Three in four online shops started in 2022 have already closed. Dental practices, pharmacies and solicitors are among the most likely to still be open.
Company formations by trade, 2019 to 2026. The boom was online shops and property vehicles. Three in four of the online shops are already gone. The trades that last are the licensed ones, and the one thing still growing in 2026 is software.
Published 20 October 2026 · part of the UK Business Formation Index · free to quote with attribution to Salenovo · how to cite · downloads · for journalists
Figures from the Companies House register as read on 10 October 2026, compared with the official Companies House incorporation statistics. Method and caveats at the foot of the page.
Britain registered a fifth more new companies in 2025 than in 2019: 829,933 against 687,219 on the register's search index, and 821,780 against 678,419 in the official statistics, a rise of 21% either way. I wanted to know what those companies were set up to do, and whether they lasted. So I counted, for each of the 731 trade codes a founder can choose, how many companies registered it in each year since 2019, how many of the 2022 intake had left the register by the end of 2025, and how 2026 is running against 2025. For twelve high street trades I downloaded the companies themselves and placed them by postcode, so the piece can say where as well as what.
One thing to hold onto before any growth figure. A company can register up to four trade codes, and founders tick more boxes than they used to: 1.30 codes per company in 2019, 1.47 in 2025. Code assignments grew 36% while companies grew 21%. A trade whose count rose 36% has simply kept pace with the register. Every percentage below should be read against that 36%, not against zero.
What grew
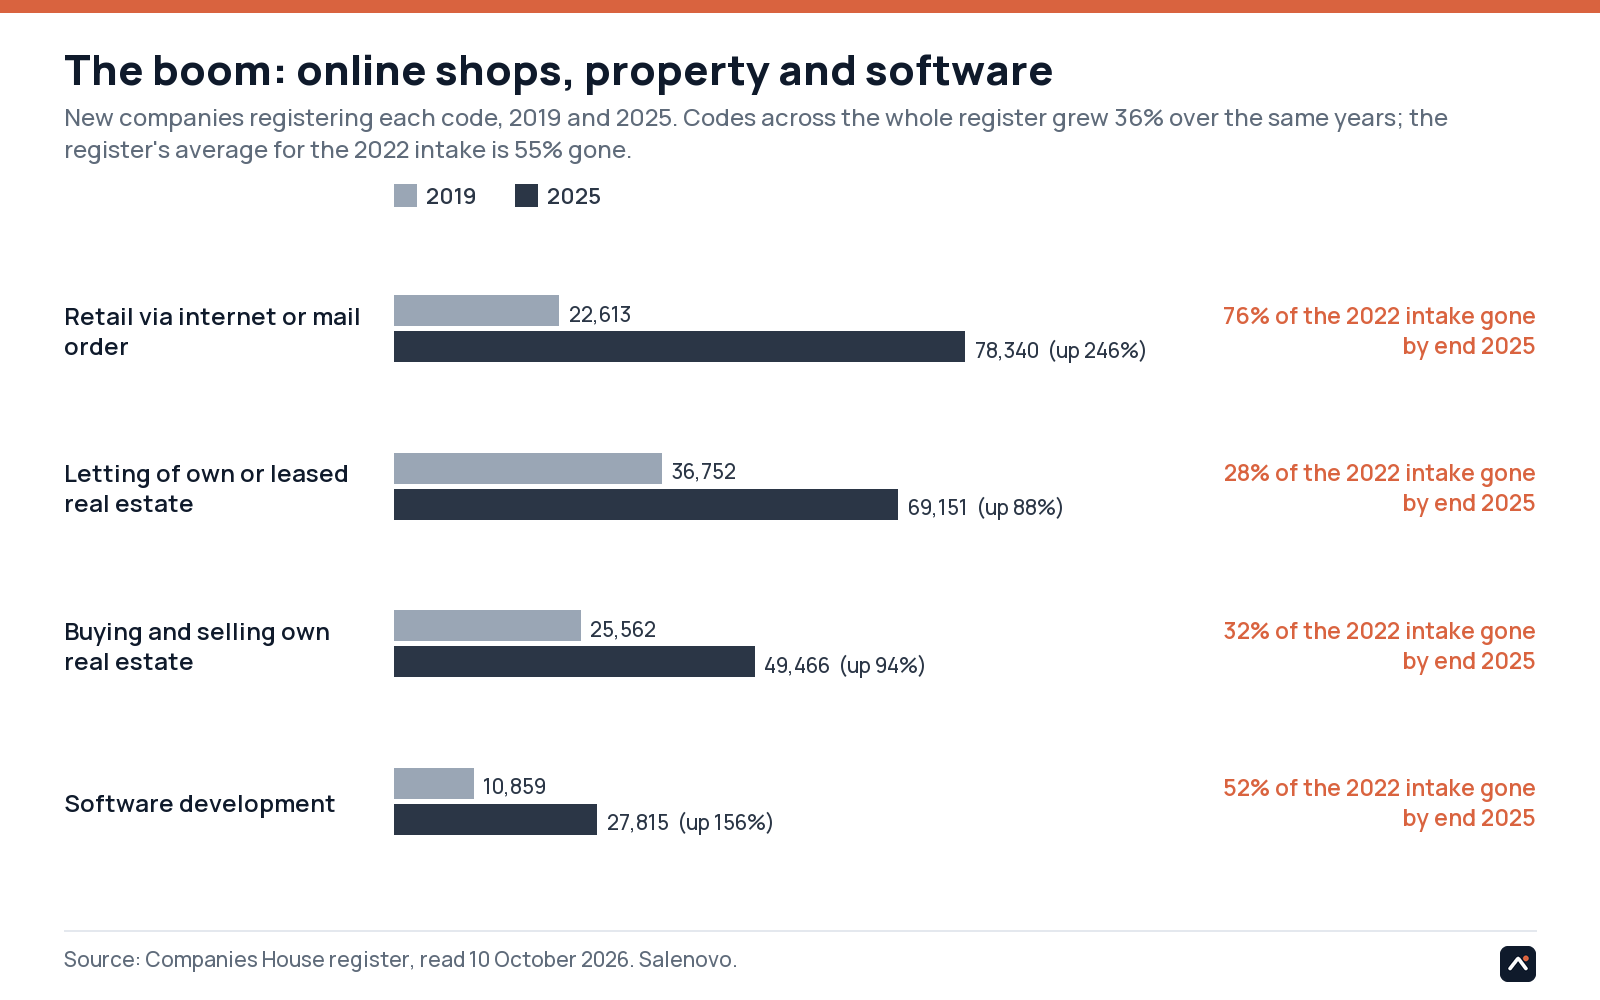
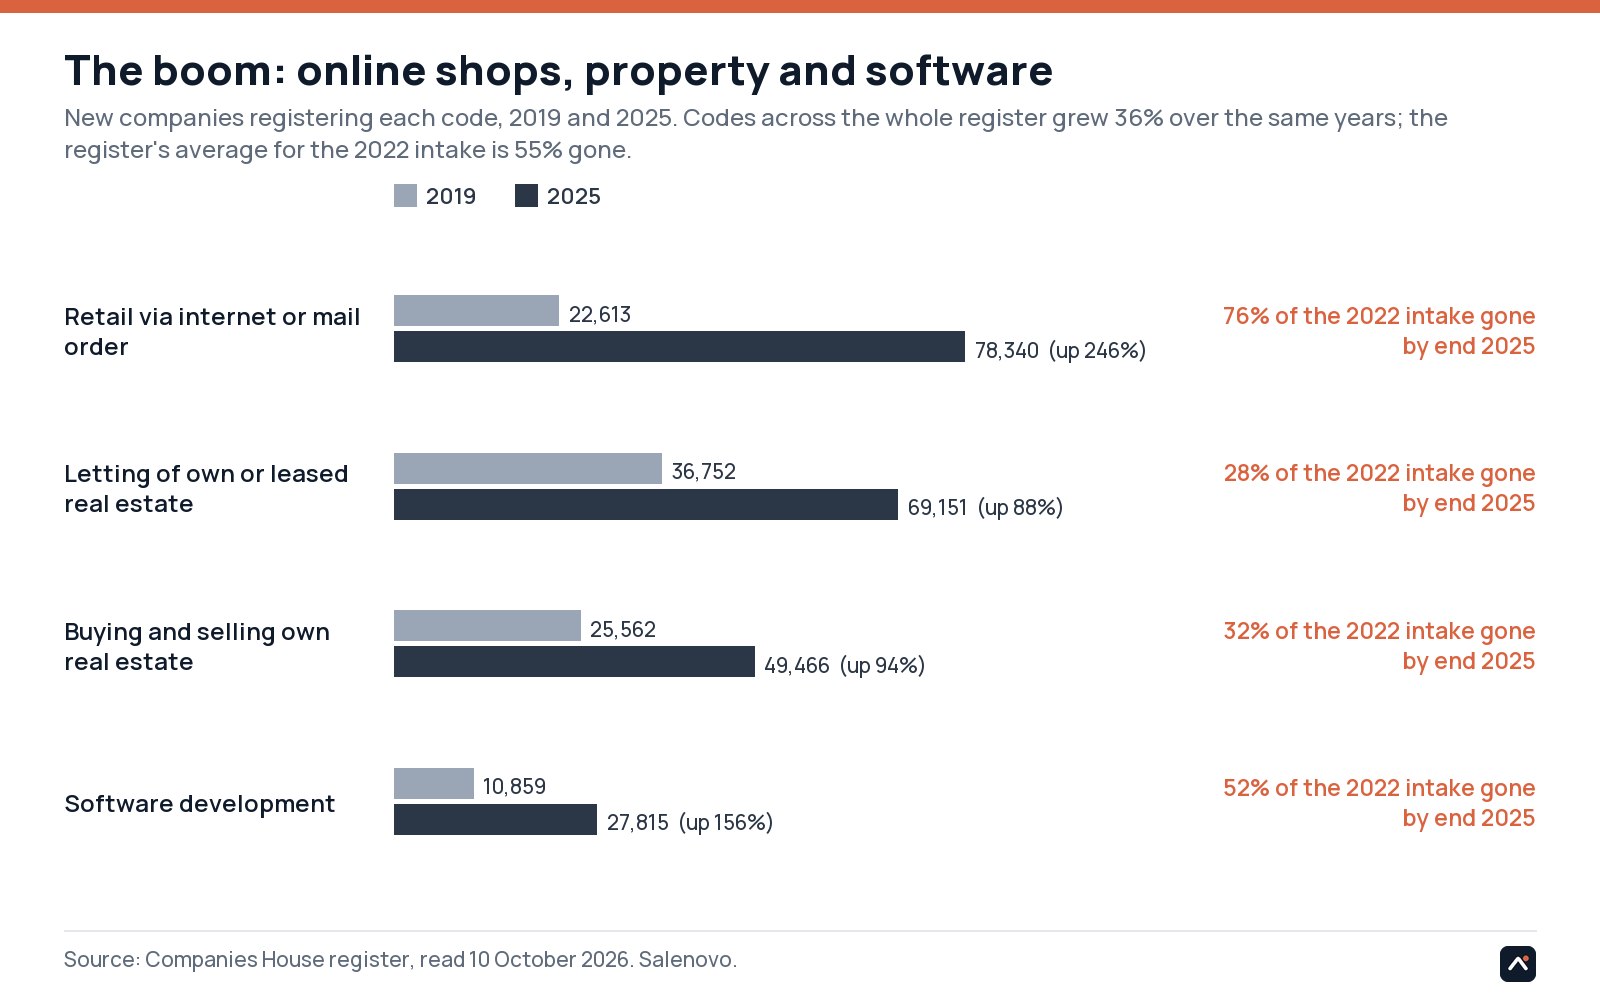
Three codes dominate the rise. Online and mail order retail went from 22,613 new companies in 2019 to 78,340 in 2025, up 246%. Letting of own or leased property went from 36,752 to 69,151, up 88%. Buying and selling own property went from 25,562 to 49,466, up 94%. With software development (10,859 to 27,815, up 156%) those four codes account for a third of all the extra code assignments on the register.
The two halves of that boom couldn't be more different. Of the 53,742 online retail companies formed in 2022, 41,070 had dissolved by the end of 2025: 76%, within three to four years. Of the property letting companies formed in 2022, 28% had gone; of the property dealers, 32%. The register's average for the 2022 intake is 55%.
Underneath, the trades you can see on a high street grew, mostly at or above the register's pace. Hairdressers and beauty salons rose 49% (10,634 to 15,836), vehicle repair 46%, takeaways 61% (14,628 to 23,581), cafés 68%, convenience stores 91%, cleaners 108%, gyms and sports facilities 108%, roofers 119%, driving schools 125% (446 to 1,005) and pharmacies 156% (367 to 940). Construction fell behind the register rather than standing still: construction as a whole rose 7%, specialised trades 15%, civil engineering fell 32%. Road haulage fell 18%, telecoms 28%, accounting and auditing 15% (though bookkeeping rose 9% and tax consultancy 22%).
The three catch-all codes (other services, other business support, dormant) fell by 24,895 assignments between them. Even if every one of those founders now picks a real trade, that explains at most a fifteenth of the growth in the risers.
| Trade (SIC) | 2019 | 2025 | Change | 2022 intake gone by end 2025 |
|---|---|---|---|---|
| Retail via internet or mail order (47910) | 22,613 | 78,340 | +246% | 76% |
| Letting of own or leased real estate (68209) | 36,752 | 69,151 | +88% | 28% |
| Buying and selling own real estate (68100) | 25,562 | 49,466 | +94% | 32% |
| Software development (62012) | 10,859 | 27,815 | +156% | 52% |
| Holding companies (64209) | 9,512 | 21,133 | +122% | 22% |
| Takeaways and mobile food (56103) | 14,628 | 23,581 | +61% | 65% |
| Advertising agencies (73110) | 6,590 | 14,698 | +123% | 62% |
| Other IT services (62090) | 10,401 | 18,284 | +76% | 56% |
| Other retail not in stores (47990) | 8,830 | 16,206 | +84% | 83% |
| Other education (85590) | 6,936 | 14,119 | +104% | 46% |
| Non-specialised wholesale (46900) | 5,455 | 11,984 | +120% | 70% |
| Hairdressing and beauty (96020) | 10,634 | 15,836 | +49% | 56% |
| Cafés (56102) | 7,280 | 12,221 | +68% | 57% |
| General cleaning (81210) | 3,725 | 7,733 | +108% | 76% |
| Convenience stores (47110) | 4,086 | 7,793 | +91% | 49% |
| Vehicle repair (45200) | 6,701 | 9,774 | +46% | 52% |
| Roofing (43910) | 1,828 | 3,997 | +119% | 58% |
| Sports facilities (93110) | 739 | 1,540 | +108% | 40% |
| Driving schools (85530) | 446 | 1,005 | +125% | 44% |
| Pharmacies (47730) | 367 | 940 | +156% | 24% |
| Dental practices (86230) | 1,364 | 2,270 | +66% | 17% |
| Taxi operation (49320) | 2,646 | 4,115 | +56% | 47% |
| The fallers | 2019 | 2025 | Change | 2022 intake gone by end 2025 |
|---|---|---|---|---|
| Other service activities n.e.c. (96090) | 31,369 | 19,694 | down 37% | 56% |
| Dormant company (99999) | 12,417 | 7,967 | down 36% | 58% |
| Other business support n.e.c. (82990) | 30,322 | 21,552 | down 29% | 49% |
| Freight transport by road (49410) | 16,938 | 13,826 | down 18% | 72% |
| Accounting and auditing (69201) | 4,850 | 4,106 | down 15% | 36% |
| Civil engineering (division 42) | 6,764 | 4,580 | down 32% | 63% |
| Telecoms (division 61) | 3,310 | 2,382 | down 28% | 58% |
| Employment activities (division 78) | 12,517 | 12,417 | down 1% | 57% |
| Construction of buildings (division 41) | 34,897 | 36,653 | +5% | 59% |
| Specialised construction (division 43) | 47,569 | 54,597 | +15% | 51% |
Register baseline for code growth is +36%; for companies, +21%. A trade that rose 36% has kept pace with the register. "Gone" is the share of the companies formed in 2022 that had left the register by 31 December 2025.
What lasts
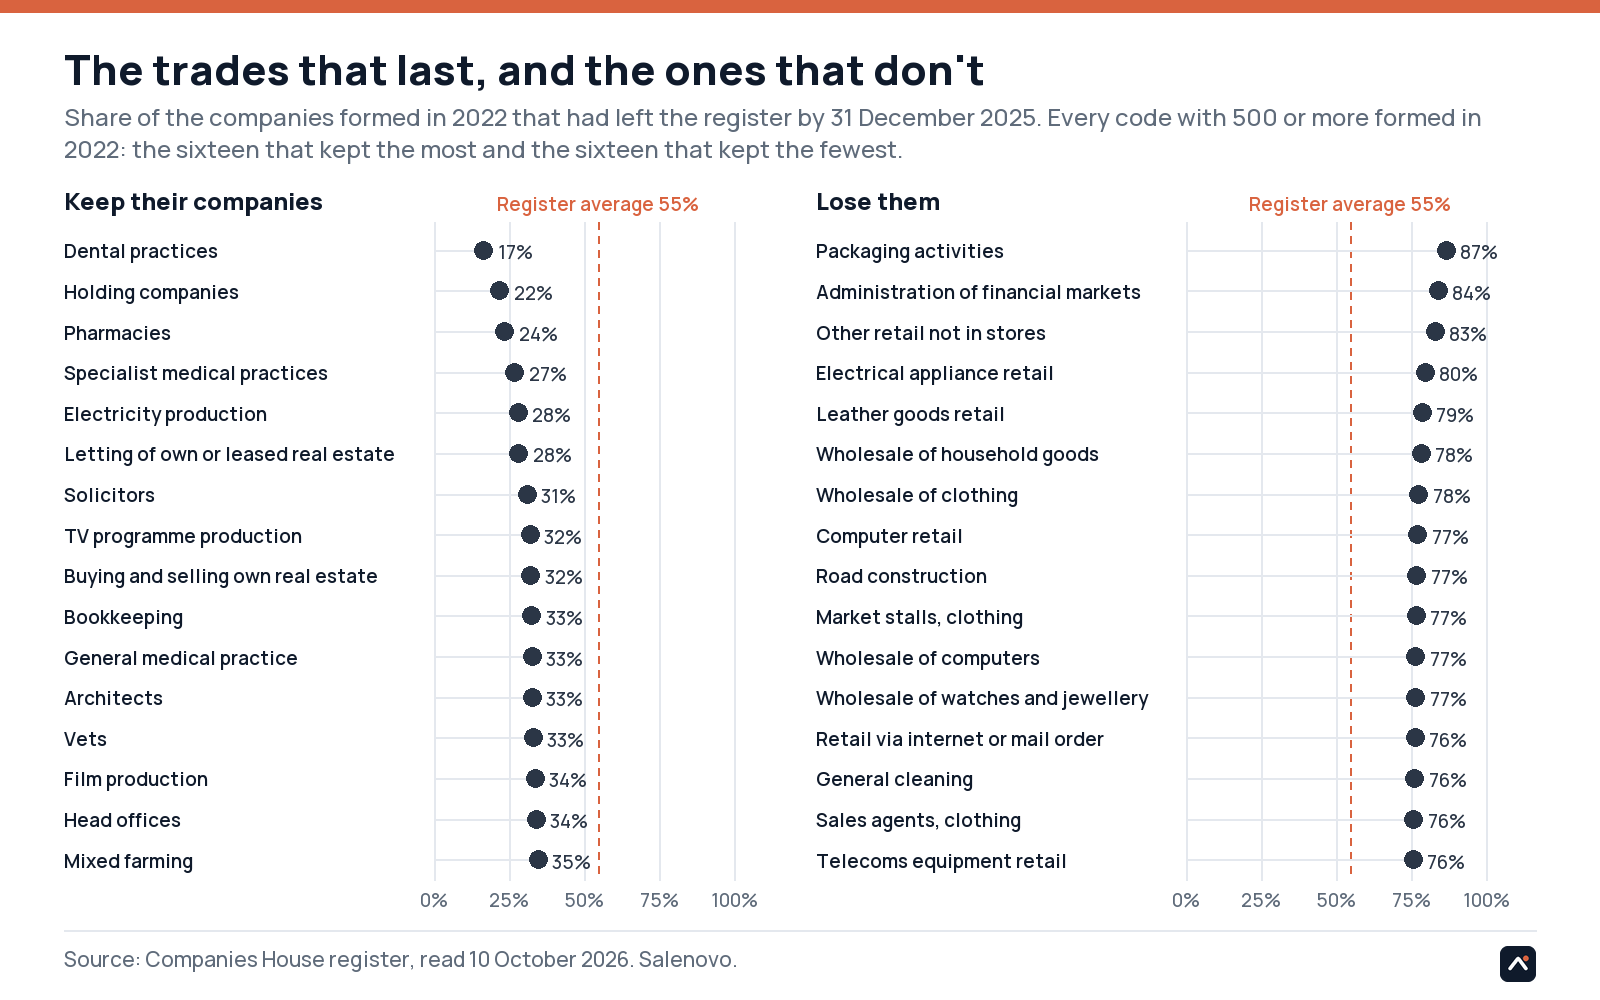
Take every trade code with at least 500 companies formed in 2022 and ask how many had left the register by 31 December 2025. The trades whose companies stay open are the licensed professions: dental practices 17%, pharmacies 24%, specialist medical practices 27%, solicitors 31%, GPs 33%, bookkeepers 33%, vets 33%, architects 33%, accountants 36%. Holding companies (22%), property letting (28%), electricity producers (28%) and television and film production (32 to 34%) mostly stay open too, so the pattern is a licence, a premises or an asset to hold, not a licence alone.
The trades where most close are retail and wholesale without a shop: packaging activities 87%, administration of financial markets 84%, non-store retail 83%, electrical appliance retail 80%, wholesale of clothing 78%, online retail 76%, general cleaning 76%, window cleaning 76%. The licensed professions lose a quarter to a third of their companies in three to four years; the no-premises retail and wholesale codes lose three quarters.
| The trades that last | Gone | The trades that don't | Gone |
|---|---|---|---|
| Dental practices | 17% | Packaging activities | 87% |
| Holding companies | 22% | Administration of financial markets | 84% |
| Pharmacies | 24% | Other retail not in stores | 83% |
| Specialist medical practices | 27% | Electrical appliance retail | 80% |
| Electricity production | 28% | Leather goods retail | 79% |
| Letting of own or leased real estate | 28% | Wholesale of household goods | 78% |
| Solicitors | 31% | Wholesale of clothing | 78% |
| TV programme production | 32% | Computer retail | 77% |
| Buying and selling own real estate | 32% | Road construction | 77% |
| Bookkeeping | 33% | Market stalls, clothing | 77% |
| General medical practice | 33% | Wholesale of computers | 77% |
| Architects | 33% | Wholesale of watches and jewellery | 77% |
| Vets | 33% | Retail via internet or mail order | 76% |
| Film production | 34% | General cleaning | 76% |
| Head offices | 34% | Sales agents, clothing | 76% |
| Mixed farming | 35% | Telecoms equipment retail | 76% |
Every code with 500 or more companies formed in 2022, the sixteen that kept the most and the sixteen that kept the fewest, in order of the one-decimal figures in sic_table.csv. The register-wide figure for the 2022 intake is 55% (439,246 of 802,467, live advanced search, 10 October 2026).
2026 has turned
Officially, the first half of 2026 was 5.7% below the first half of 2025 (396,899 new companies against 420,910). On the index, the first nine months are 7.4% below (595,287 against 643,185); the official third quarter is due in late October and until then the nine-month figure is provisional.
The biggest falls in absolute terms are the two property codes: buying and selling own property is down 7,179 companies on the same nine months of 2025, letting down 6,519. Then come the catch-all "other services" code (down 4,679), online retail (down 4,306, which is 7%, in line with the register) and non-store retail (down 4,086). The sharpest proportional falls are in the "agents involved in the sale of" codes: clothing agents down 71% (3,359 to 990), variety-of-goods agents down 43%. That looks like a formation channel changing rather than 2,369 fewer clothing agents. Two things changed on the register in this window: the incorporation fee rose to £50 on 1 May 2024, and from 18 November 2025 the directors of new companies have had to verify their identity with Companies House. These figures can't say which, if either, is responsible.
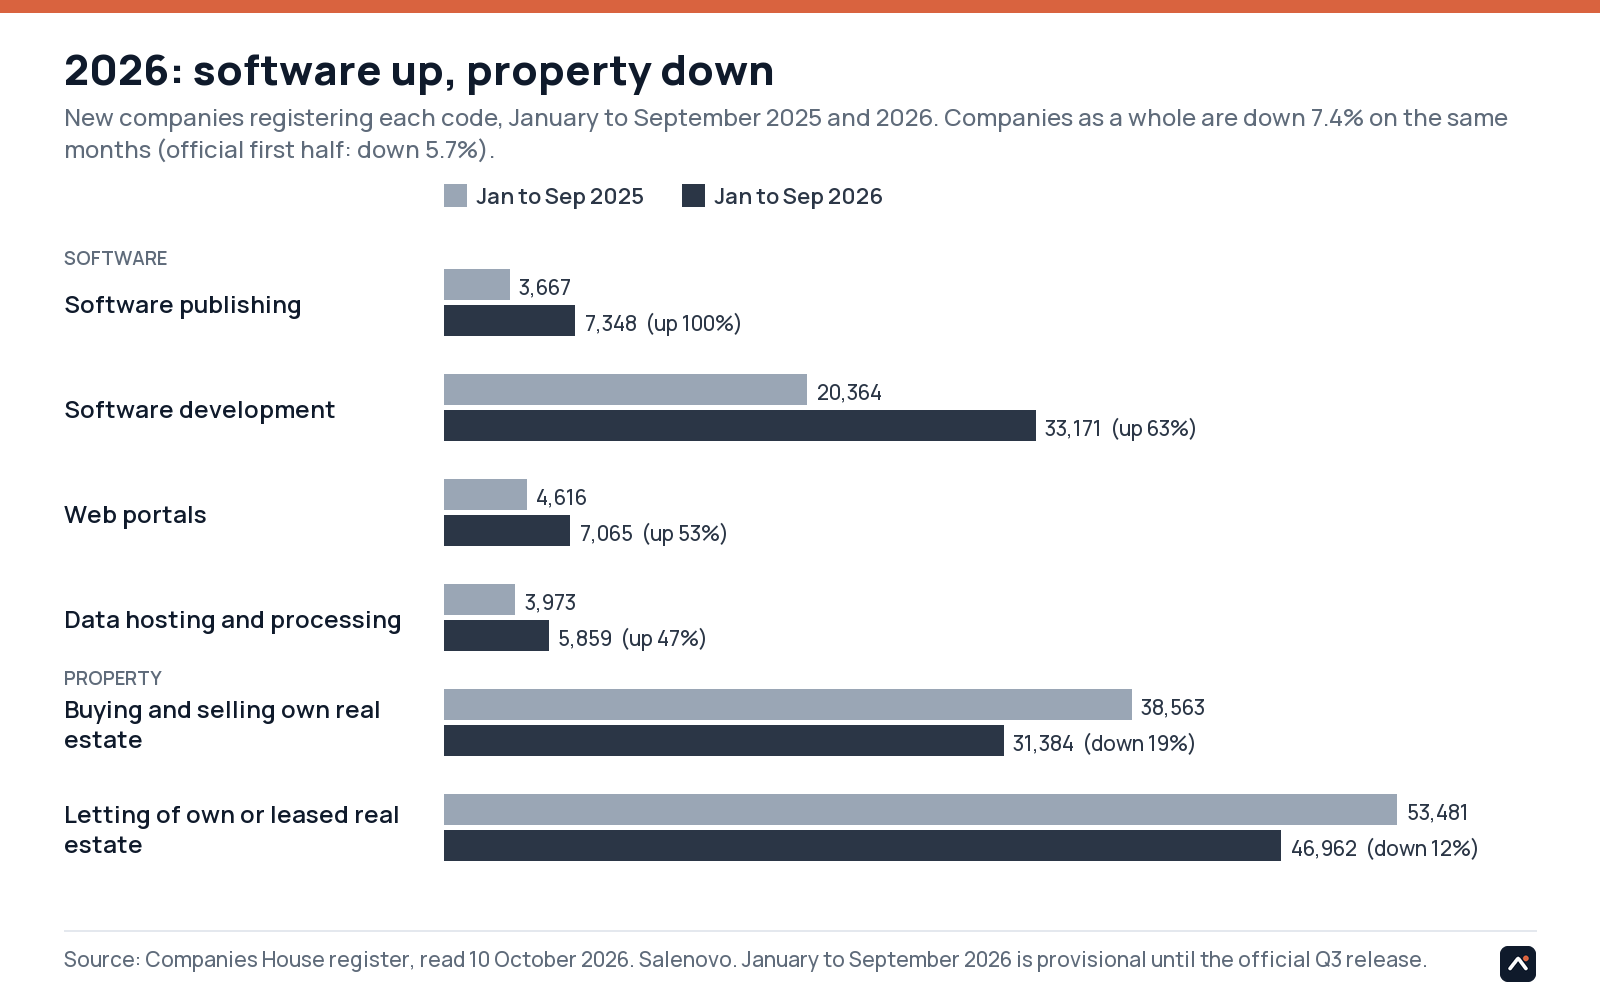
Against the fall, software is the one large sector still growing fast. Software publishing is up 100% on the same nine months of 2025 (3,667 to 7,348), software development up 63% (20,364 to 33,171), web portals up 53%, data hosting up 47%, research and development up 49%, and the software division as a whole up 25%. It's the largest grower, not the only one: reservation services are up 50%, exhibition organisers 44%, facilities support 44%, social work 43%, head offices 39% and sports facilities 31%.
| Growing | Jan to Sep 2025 | Jan to Sep 2026 | Change |
|---|---|---|---|
| Software publishing (58290) | 3,667 | 7,348 | +100% |
| Software development (62012) | 20,364 | 33,171 | +63% |
| Web portals (63120) | 4,616 | 7,065 | +53% |
| Other reservation services (79909) | 667 | 1,001 | +50% |
| R&D, natural sciences (72190) | 1,686 | 2,515 | +49% |
| Data hosting and processing (63110) | 3,973 | 5,859 | +47% |
| Exhibition and fair organisers (82301) | 1,299 | 1,877 | +44% |
| Combined facilities support (81100) | 1,138 | 1,635 | +44% |
| Social work without accommodation (88990) | 2,914 | 4,158 | +43% |
| Auxiliary financial activities (66190) | 965 | 1,362 | +41% |
| Head offices (70100) | 1,053 | 1,459 | +39% |
| Leasing of intellectual property (77400) | 500 | 673 | +35% |
| Technical testing (71200) | 844 | 1,107 | +31% |
| Sports facilities (93110) | 1,158 | 1,516 | +31% |
| Falling | Jan to Sep 2025 | Jan to Sep 2026 | Change |
|---|---|---|---|
| Sales agents, clothing (46160) | 3,359 | 990 | down 71% |
| Administration of financial markets (66110) | 405 | 143 | down 65% |
| Sales agents, furniture and hardware (46150) | 1,244 | 510 | down 59% |
| Wholesale of office furniture (46650) | 335 | 143 | down 57% |
| Investment trusts (64301) | 545 | 264 | down 52% |
| Real estate investment trusts (64306) | 498 | 248 | down 50% |
| Wholesale of watches and jewellery (46480) | 974 | 502 | down 48% |
| Video distribution (59132) | 310 | 166 | down 46% |
| Open-ended investment companies (64304) | 1,021 | 552 | down 46% |
| Wholesale of pharmaceutical goods (46460) | 972 | 542 | down 44% |
| Electrical appliance retail (47540) | 811 | 458 | down 44% |
| Sales agents, variety of goods (46190) | 5,809 | 3,283 | down 43% |
Codes with 300 or more companies formed in January to September 2025; the fourteen fastest risers and the twelve sharpest fallers. Companies as a whole are down 7.4% on the index (595,287 against 643,185), provisional until the official July to September release; the official first half is down 5.7%. Too recent for a survival figure.
Where
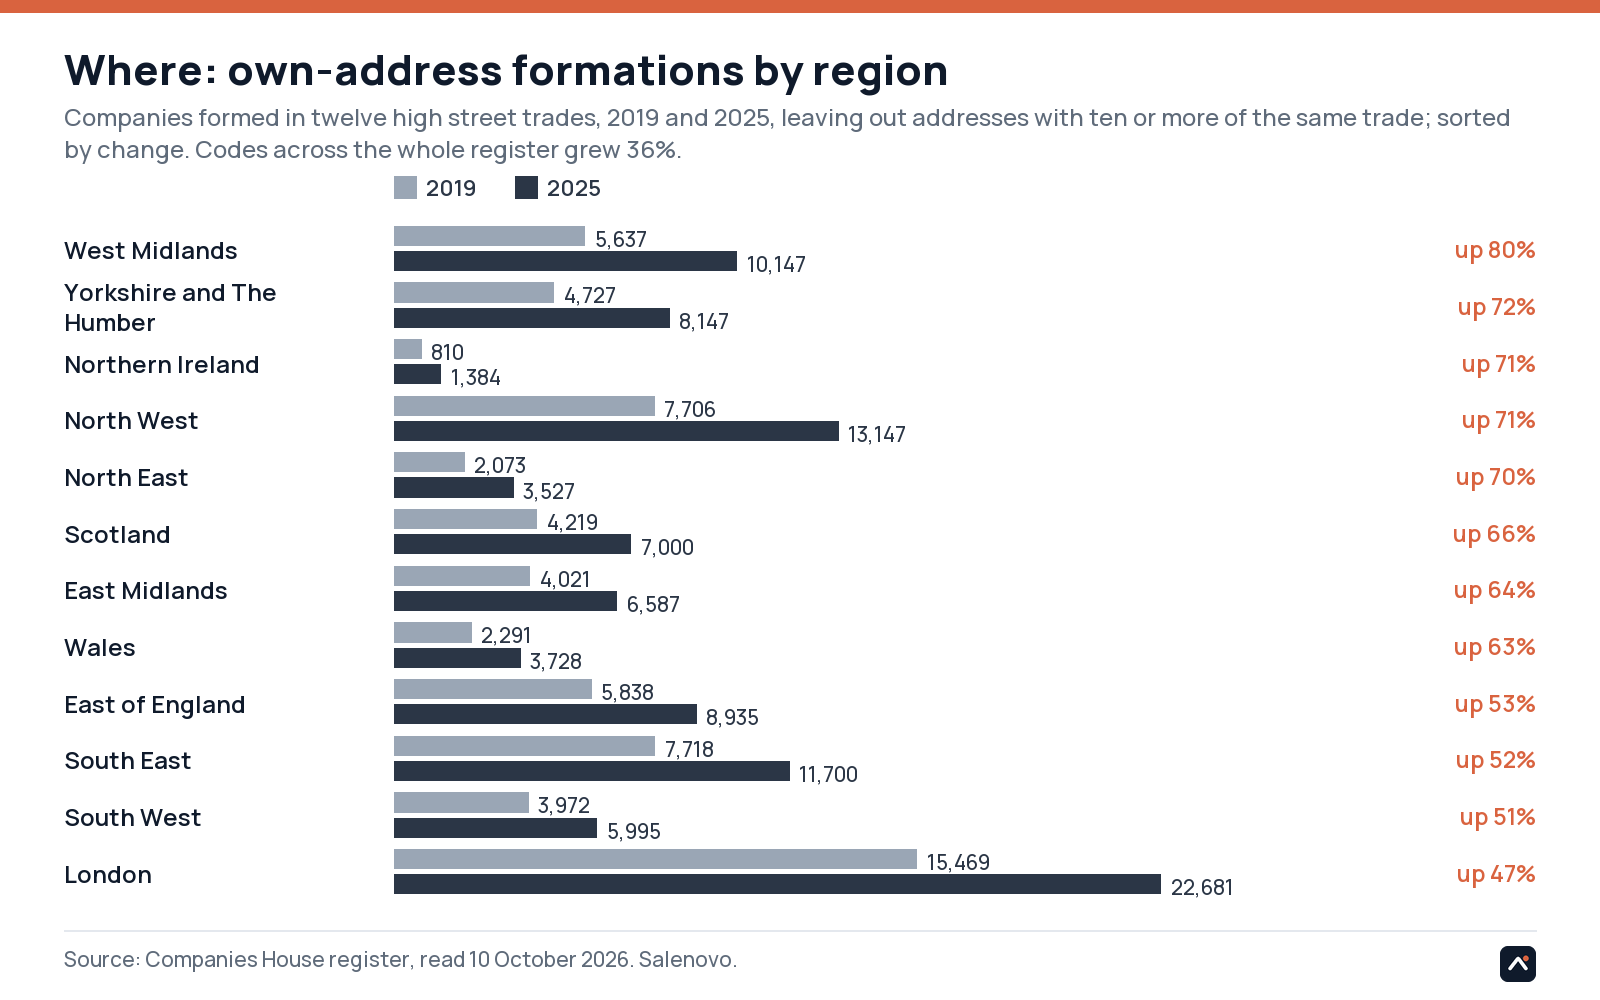
For twelve high street trades I downloaded every company formed in 2019 and in 2025 and placed it by the postcode of its registered office, leaving out addresses that host ten or more companies of the same trade (formation agents and accountants), which places 97 to 99% of them. Pooled across the twelve trades the West Midlands grew fastest, from 5,637 own-address formations in 2019 to 10,147 in 2025 (up 80%), then Yorkshire (72%), Northern Ireland (71%), the North West (71%) and the North East (70%). London grew slowest, from 15,469 to 22,681 (47%), with the South West (51%), the South East (52%) and East of England (53%) just above it. Codes on the whole register grew 36% over the same years.
Trade by trade the picture is less tidy. In hairdressing, takeaways, cafés, convenience stores, cleaning, vehicle repair, other education and other human health the fastest growth is in the North, the Midlands and the devolved nations, and Birmingham leads every one of them on absolute rises (hairdressing up 127 to 369 own-address formations in 2025; takeaways up 384 to 765; cafés up 199 to 416). In roofing, driving schools, sports facilities and pharmacies London and the South East are among the fastest-growing, so there's no single "London grew slowest" story. Your council's and constituency's figures for all twelve trades are on its own page.
The eight trades with large regional bases
| Trade | UK, 2019 to 2025 | 2022 intake gone (UK) | Fastest-growing regions | Slowest | Most new companies in 2025 | Biggest council rises |
|---|---|---|---|---|---|---|
| Hairdressing and beauty | +49% | 56% | North East +111% (283 to 598), Northern Ireland +105%, Yorkshire and The Humber +75%, Wales +73% | London +26% (2,600 to 3,288), South West +44%, East of England +47% | Birmingham 369, Manchester 257, Glasgow City 220, Leeds 199, Liverpool 190 | Birmingham +127, Manchester +109, Bradford +86, Leeds +68, Sandwell +65 |
| Takeaways | +61% | 65% | West Midlands +97% (1,083 to 2,138), East Midlands +79%, Yorkshire and The Humber +77%, North West +76% | Scotland +51% (1,170 to 1,769), South West +53%, Wales +54% | Birmingham 765, Manchester 476, Glasgow City 391, Liverpool 334, Newham 326 | Birmingham +384, Newham +178, Liverpool +174, Manchester +170, Harrow +134 |
| Cafés | +68% | 57% | West Midlands +97% (555 to 1,092), East of England +79%, Yorkshire and The Humber +75%, Wales +70% | Northern Ireland +35% (155 to 209), North East +46%, East Midlands +58% | Birmingham 416, Newham 239, Manchester 229, Glasgow City 214, Tower Hamlets 200 | Birmingham +199, Newham +136, Liverpool +89, Manchester +89, City of Edinburgh +87 |
| Convenience stores | +91% | 49% | Yorkshire and The Humber +176% (254 to 701), North West +118%, East Midlands +117%, West Midlands +106% | Northern Ireland +21% (52 to 63), London +51%, South West +59% | Birmingham 279, Glasgow City 189, Liverpool 184, Leicester 148, Ealing 131 | Birmingham +168, Liverpool +114, Leicester +87, Glasgow City +76, Sheffield +66 |
| General cleaning | +108% | 76% | North East +210% (60 to 186), East Midlands +171%, North West +151%, West Midlands +144% | South West +72% (229 to 393), South East +72%, London +73% | Birmingham 193, Manchester 145, Leeds 127, Newham 125, Coventry 111 | Birmingham +100, Manchester +92, Coventry +79, Leeds +67, Barking and Dagenham +65 |
| Vehicle repair | +46% | 52% | Northern Ireland +80% (71 to 128), North East +80%, West Midlands +78%, North West +50% | South East +27% (873 to 1,112), East Midlands +30%, East of England +30% | Birmingham 309, Manchester 128, Sandwell 114, Glasgow City 113, North Northamptonshire 105 | Birmingham +147, Sandwell +68, Wolverhampton +44, Bolton +42, Manchester +42 |
| Other education | +104% | 46% | Wales +94% (181 to 352), West Midlands +93%, Scotland +93%, North West +86% | South West +58% (460 to 728), London +59%, East of England +60% | Birmingham 302, Manchester 189, Tower Hamlets 167, Westminster 148, Newham 142 | Birmingham +138, Manchester +91, Enfield +69, Croydon +65, Glasgow City +62 |
| Other human health | +32% | 45% | Northern Ireland +93% (103 to 199), Scotland +61%, Wales +49%, North West +34% | London +11% (2,756 to 3,059), East of England +12%, South East +15% | Birmingham 403, Manchester 251, Leeds 209, Westminster 196, Barnet 171 | Birmingham +96, Glasgow City +49, Bolton +43, Preston +41, City of Edinburgh +39 |
Own-address formations: companies formed in 2019 and 2025, leaving out addresses with ten or more companies of the same trade among them. Regional percentages only where the 2019 base is 50 or more. The UK change and survival columns are for every company in the trade. Register baseline for code growth +36%.
The four with small regional bases, as counts
| Trade | UK, 2019 to 2025 | 2022 intake gone (UK) | 2019 to 2025 by region (own-address counts) | Most new companies in 2025 |
|---|---|---|---|---|
| Roofing | +119% | 58% | London 268 to 638, South East 260 to 616, North West 208 to 456, East of England 179 to 368, West Midlands 139 to 263, Scotland 143 to 256, South West 123 to 252, Yorkshire and The Humber 140 to 242, East Midlands 106 to 193, Wales 78 to 135, North East 74 to 124, Northern Ireland 10 to 40 | Hillingdon 59, Manchester 47, Bournemouth, Christchurch and Poole 46, Ealing 45, Leeds 45 |
| Driving schools | +125% | 44% | London 80 to 206, South East 56 to 123, East of England 34 to 100, North West 54 to 98, West Midlands 45 to 96, East Midlands 37 to 83, Yorkshire and The Humber 31 to 71, Scotland 23 to 70, South West 32 to 68, North East 18 to 26, Wales 12 to 20, Northern Ireland 1 to 5 | Birmingham 22, Bradford 19, Manchester 19, Redbridge 17, Newham 16 |
| Sports facilities | +108% | 40% | London 117 to 258, North West 68 to 199, South East 108 to 188, East of England 68 to 132, Yorkshire and The Humber 60 to 132, West Midlands 55 to 128, East Midlands 40 to 106, South West 66 to 93, Scotland 38 to 89, Wales 40 to 56, North East 28 to 35, Northern Ireland 15 to 26 | Leeds 27, Birmingham 25, Glasgow City 23, Bradford 22, Liverpool 19 |
| Pharmacies | +156% | 24% | London 70 to 180, West Midlands 41 to 144, North West 40 to 91, South East 39 to 86, Yorkshire and The Humber 42 to 78, East of England 22 to 53, East Midlands 30 to 52, North East 8 to 46, South West 21 to 41, Scotland 24 to 31, Wales 10 to 22, Northern Ireland 4 to 4 | Birmingham 49, Leeds 23, Walsall 20, Harrow 18, Manchester 18 |
Several regions had fewer than 50 of these companies in 2019, so these are counts, not percentages.
The tables behind every figure here are in the downloads below: every trade code (sic_table.csv), every council and every constituency for the twelve trades.
What these figures can and can't say
A trade is a code the founder chose at incorporation, up to four per company, and founders chose more in 2025 than in 2019. Formed isn't trading, and dissolved isn't failed: most dissolutions come 18 to 30 months after formation, when the first filings fall due and the registrar strikes off companies that don't file. "Gone" means left the register. The 2022 intake had three to four years of exposure depending on the month of formation; the ranking of trades is fair because every trade's intake has the same month mix. Geography is the registered office, which is often the owner's home or accountant. The search index runs about 1% above the official statistical series throughout, so growth rates are unaffected. Nothing here says why any of it happened.
How the counts were made, the own-address rule and the corrections are on the method page.
Downloads
Cite this
Free to quote and reproduce with attribution. Suggested form:
To put the chart on your own page, with the credit built in:
The data are Companies House and ONS material under the Open Government Licence v3.0. A cut for any region or council is available on request: matt@salenovo.com.
Council-by-council survival and trading rates are at /survival/; the method, its accuracy and its agreement with ONS Business Demography at /method/. Every incorporation, weekly, by council: the Formation Index.