Which new companies last? What three years of results tell businesses about choosing who to deal with
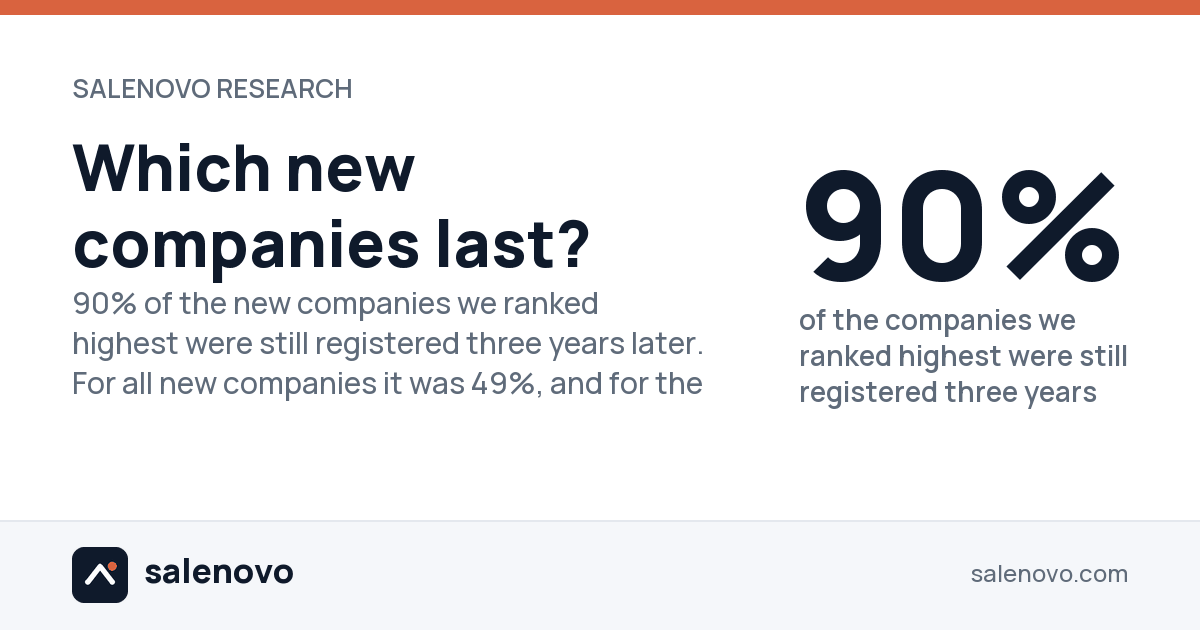
Half of the companies formed in the UK are gone within three years. We ranked 20,000 of them with a model that had never seen them and followed every one: 90% of the ones we ranked highest were still registered three years later, compared with 49% of all new companies.
Published 18 September 2026 · part of the Business Survival Index · free to quote with attribution to Salenovo · how to cite · downloads · for journalists
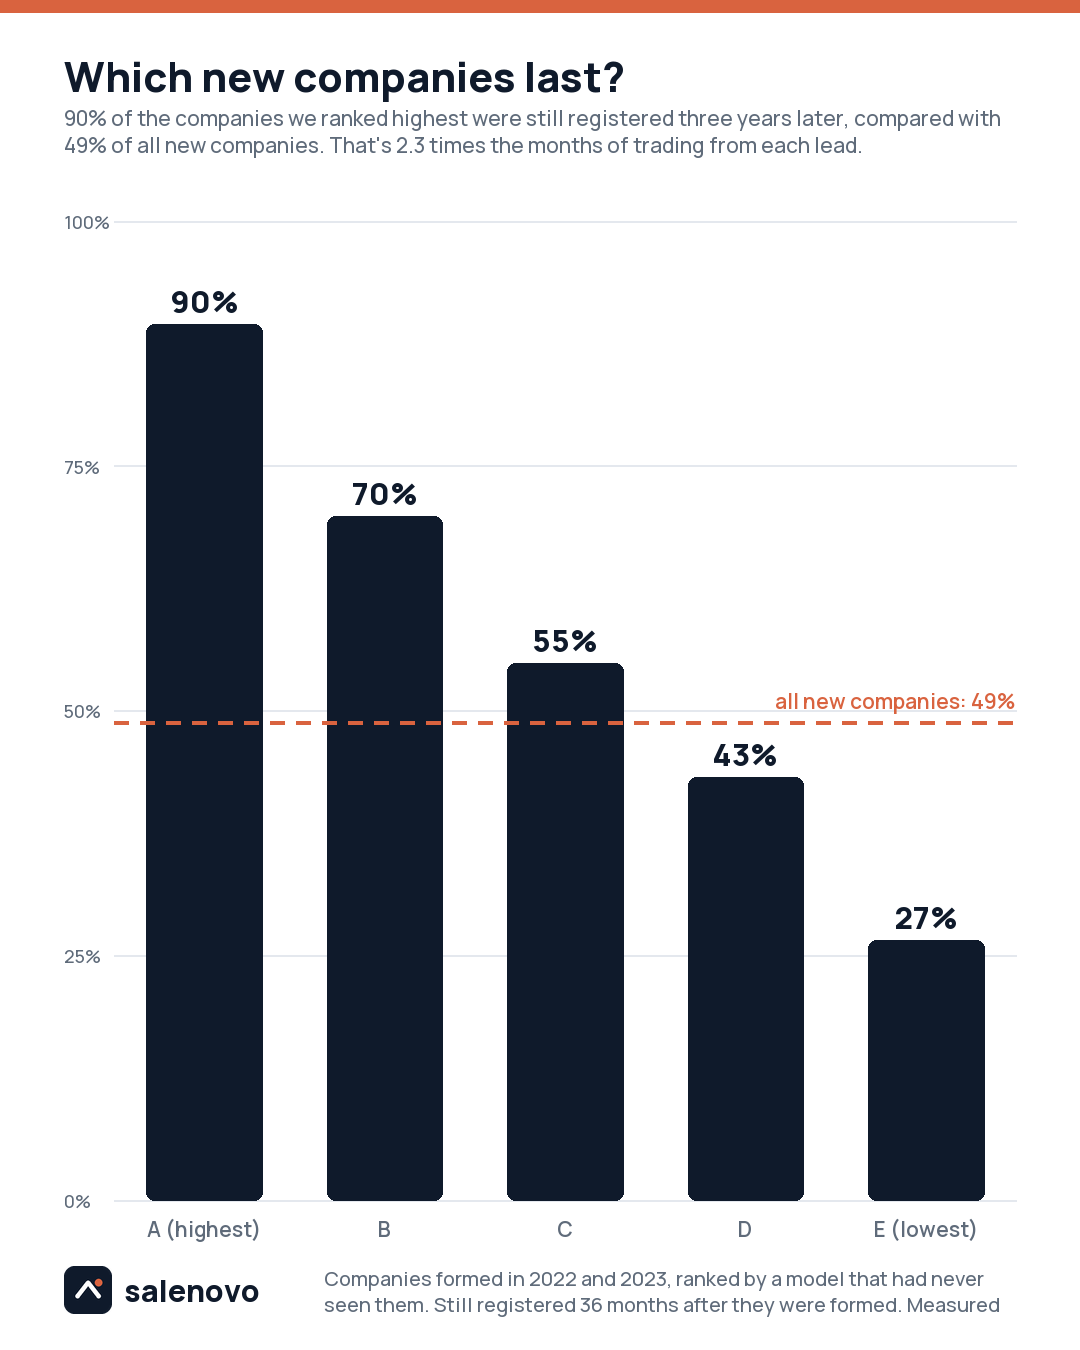
Most new companies don't last. The ones we rank highest mostly do. 90% of them were still registered three years later, against 49% of all new companies. Over those three years each one traded for 2.3 times as long as the average.
Measured on 20,000 real companies our model had never seen. We check it again every month.
Measured on 20,000 real companies that our model had never seen, followed for three years, including the ones that closed. How we know
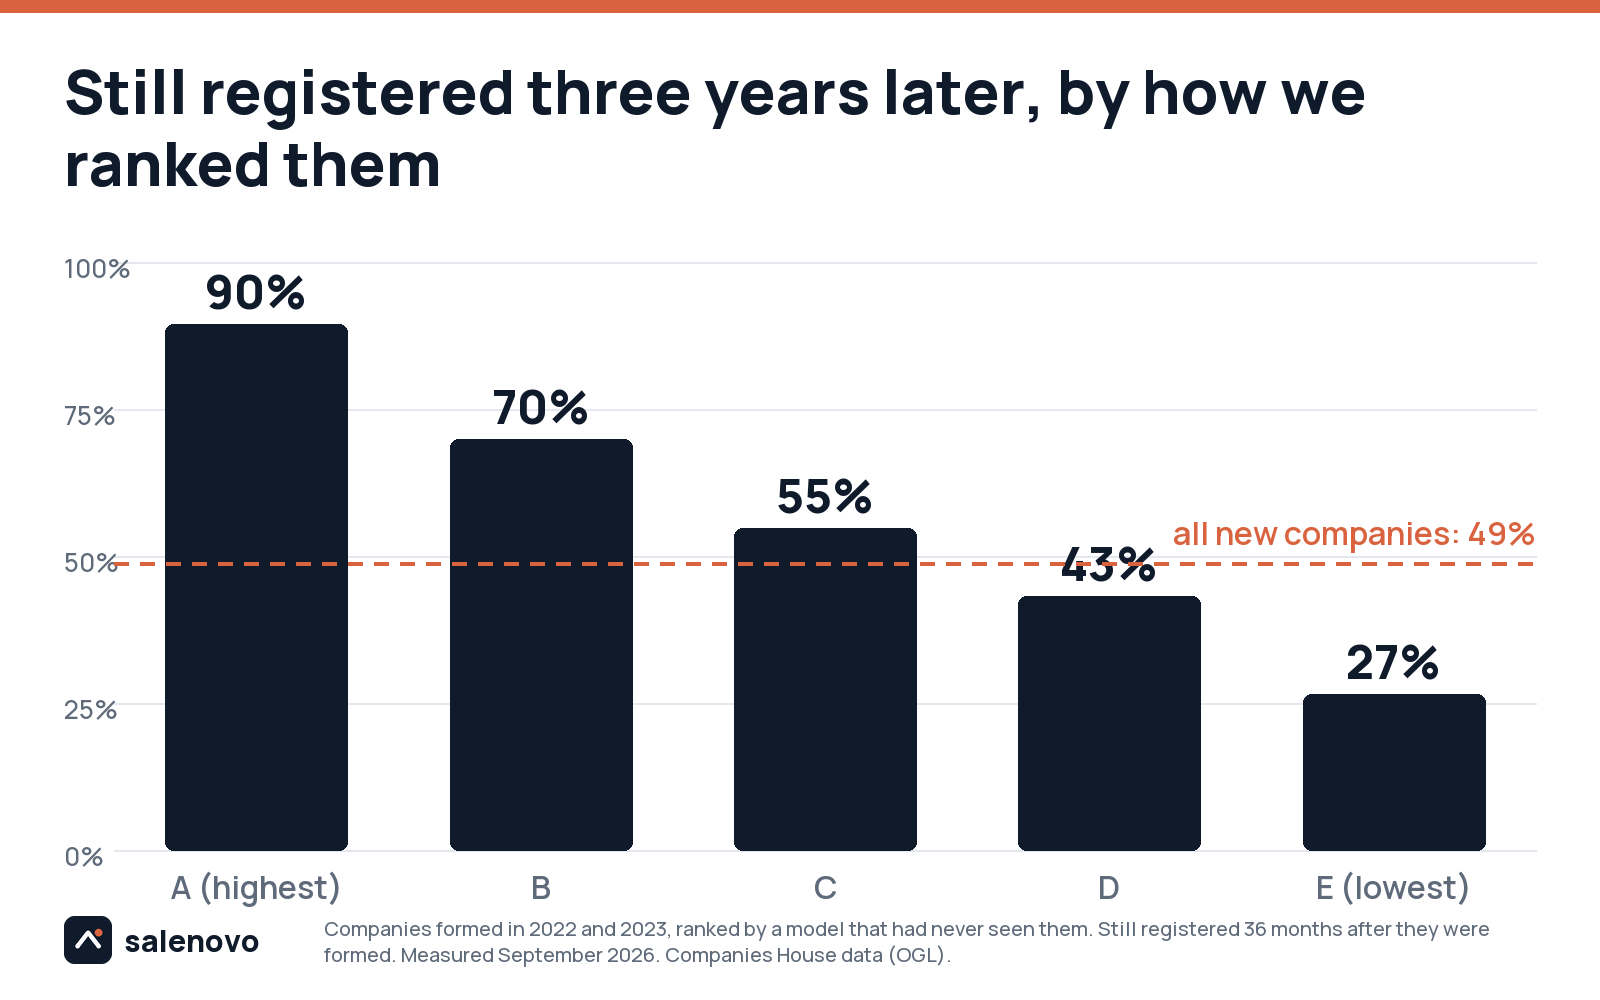
Still registered three years later, by how we ranked them
Companies formed in 2022 and 2023, ranked by a model that had never seen them. Measured September 2026.
Why this matters
A new company is a promise, not yet a business. Two in three of the companies formed in the UK never trade, and half are removed from the register within three years. Nearly half of those are struck off at about seventeen months, for never filing their first confirmation statement. (The Business Survival Index has the figures for every council.) Anyone who sells to new businesses, lends to them, insures them or does their accounts spends most of their effort on a full list chasing companies that will never trade. The useful question on the day a company is formed isn't "is this a company?" but "will it last?"
How we did it
The companies. 30,000 companies picked at random from six months of new registrations (March and September of 2022, 2023 and 2024). Each one is described only by what's public on the day it's formed: its registered address and how many other companies share it, its directors' past companies, its name and business type, whether it has a matching website, and similar.
A fair test. We split the companies into five groups and ranked each group with a model built from the other four, so no company was ranked by a model that already knew what happened to it. We then grouped them A to E using the same cut-off points we use today. Those cut-offs split today's new companies into five equal fifths. Older companies score lower, so in 2022 and 2023 fewer of them reached A (14%) and more fell into E (39%).
What happened to them. We took each company's real closing date from our full record of every company formed in 2022 to 2024, including the ones that have closed. That matters: a study that only looks at companies still on the register would miss every failure. Companies still open are followed up to the date we last checked the register. We used a standard method for survival figures (Kaplan-Meier), which handles companies we haven't yet followed for the full time, and every figure comes with a 95% confidence range.
Two ways of measuring value. The share of companies still registered after one, two and three years. And the number of months, out of the first 36, that each company spent registered as a business that went on to trade, which is the closest public measure of how long a company is someone's customer.
What we found
90% of the new companies we ranked highest were still registered three years later. For all new companies it was 49%, and for the ones we ranked lowest 27%. Each group lasted longer than the one below it, and the gap grew over time, because most failing companies are struck off in their second year. Counting months of trading in the first three years, a company we ranked highest gave 27, the average new company 12 and one we ranked lowest 5. That's 2.3 times the average and 5.7 times the lowest group.
| Ranking | Companies | Went on to trade | Still registered at 12 months | Still registered at 24 months | Still registered at 36 months | Months registered, of the first 36 | Months trading, of the first 36 |
|---|---|---|---|---|---|---|---|
| A, ranked highest | 2,779 | 76% | 99% (99% to 99%) | 94% (93% to 95%) | 90% (88% to 91%) | 34.5 | 27.4 |
| B | 2,987 | 48% | 98% (97% to 98%) | 81% (80% to 82%) | 70% (68% to 72%) | 31.5 | 17.3 |
| C | 2,866 | 36% | 96% (95% to 97%) | 70% (68% to 71%) | 55% (53% to 56%) | 28.9 | 12.9 |
| D | 3,592 | 27% | 95% (94% to 96%) | 58% (56% to 60%) | 43% (41% to 45%) | 26.5 | 9.7 |
| E, ranked lowest | 7,776 | 13% | 95% (94% to 95%) | 42% (41% to 43%) | 27% (26% to 28%) | 23.4 | 4.9 |
| All new companies | 20,000 | 33% | 96% (96% to 96%) | 62% (61% to 62%) | 49% (48% to 50%) | 27.5 | 11.9 |
The ranges in brackets show how sure each figure is (a 95% confidence range). Months registered is the average number of the first 36 months a company in the group stayed registered. Months trading counts the same months, but only for companies that went on to trade.
After the fee went up
The fee to set up a company rose from £12 to £50 in May 2024, and that alone stopped many of the companies that would have been struck off. Companies formed since then can be followed for two years so far, and the ranking holds for them too: 92% of the ones we ranked highest were still registered after two years, compared with 65% of all new companies and 34% of the ones we ranked lowest.
| Ranking | Companies | Went on to trade | Still registered at 12 months | Still registered at 24 months | Months registered, of the first 24 | Months trading, of the first 24 |
|---|---|---|---|---|---|---|
| A, ranked highest | 1,011 | 68% | 98% (98% to 99%) | 92% (91% to 94%) | 23.3 | 16.2 |
| B | 979 | 46% | 97% (96% to 98%) | 78% (75% to 80%) | 22.2 | 11.0 |
| C | 905 | 38% | 95% (94% to 97%) | 66% (63% to 69%) | 21.3 | 9.1 |
| D | 1,053 | 30% | 96% (94% to 97%) | 56% (53% to 59%) | 20.7 | 7.3 |
| E, ranked lowest | 1,052 | 16% | 90% (88% to 91%) | 34% (32% to 37%) | 18.5 | 3.8 |
| All new companies | 5,000 | 39% | 95% (95% to 96%) | 65% (64% to 66%) | 21.2 | 9.4 |
The ranges in brackets show how sure each figure is (a 95% confidence range). Months registered is the average number of the first 24 months a company in the group stayed registered. Months trading counts the same months, but only for companies that went on to trade.
What it means for decisions
For firms that sell to new businesses, such as accountants, suppliers, insurers and banks, it shows where effort pays off. A new customer is worth what they pay each month multiplied by how long they last, and how long they're likely to last can be estimated on the day the company is formed. Working through a list from the top isn't a matter of taste. It brings two to five times as many months of custom per call.
For lenders and credit teams, it's an early signal that exists before a company has filed anything. It isn't a credit score, but it's a measured difference in the chance that the company will still be there to repay.
For councils, Growth Hubs and policymakers, the same results area by area make up the Business Survival Index: where new companies last, where they don't, and how closely that follows deprivation. Help aimed at a company's first two years, before the seventeen-month strike-off, is aimed where most companies are lost.
What this doesn't show
Being registered isn't the same as trading, or as being your customer. Counting months of trading narrows the gap, but a company that trades may still never buy from you. A ranking isn't a verdict. Some companies we rank lowest do well, and some we rank highest close. The three-year figures are for companies formed in 2022 and 2023. We rank companies formed since the 2024 fee rise, and their two-year results are shown above. Their three-year results arrive from late 2027. Some of the model's inputs are averages across the whole register, such as how often companies at a particular address go on to trade, and that register includes these companies. At addresses with hundreds of companies the effect is too small to matter. We check these figures again every month using the Companies House register, so they will move a little as companies age. This edition was measured in September 2026.
Downloads
Cite this
Free to quote and reproduce with attribution. Suggested form:
To put the chart on your own page, with the credit built in:
The data are Companies House and ONS material under the Open Government Licence v3.0. A cut for any region or council is available on request: matt@salenovo.com.
Council-by-council survival and trading rates are at /survival/; the method, its accuracy and its agreement with ONS Business Demography at /method/. Every incorporation, weekly, by council: the Formation Index.