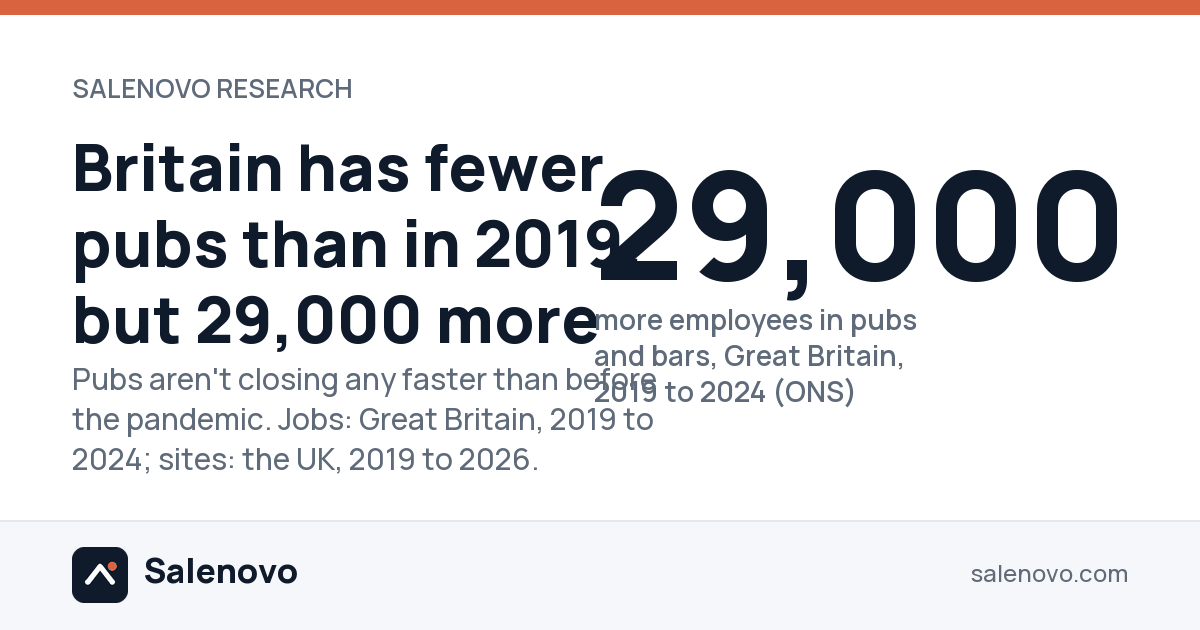
Britain has fewer pubs than in 2019, but 29,000 more people working in them
Pubs aren't closing any faster than before the pandemic, four in five are now run by a company, and the established companies went bust about half as often again in 2023 to 2025 as in 2019.
Published 27 October 2026 · part of the UK Business Formation Index · free to quote with attribution to Salenovo · how to cite · downloads · for journalists
Pub and bar sites from the Office for National Statistics (March each year, 2010 to 2026); jobs from the ONS Business Register and Employment Survey (Great Britain, 2015 to 2024); pubs on the councils' food registers as archived each spring since 2013; pub companies from the Companies House register, read 9 and 10 October 2026. Four sources, each counting something different, never added together. Method and caveats at the foot of the page.
In Great Britain, 470,000 people were employees of pubs and bars in 2024, 29,000 more than the 441,000 of 2019 (ONS, Business Register and Employment Survey). Over much the same years the number of pub and bar sites fell: the UK had 37,350 in March 2026, against 39,145 in March 2019 (ONS, UK Business Counts). The jobs are counted for Great Britain to 2024 and the sites for the UK to 2026, so the two are given side by side and never divided into jobs per pub. More employees doesn't by itself mean pubs are doing well: it counts jobs, not hours or pay.
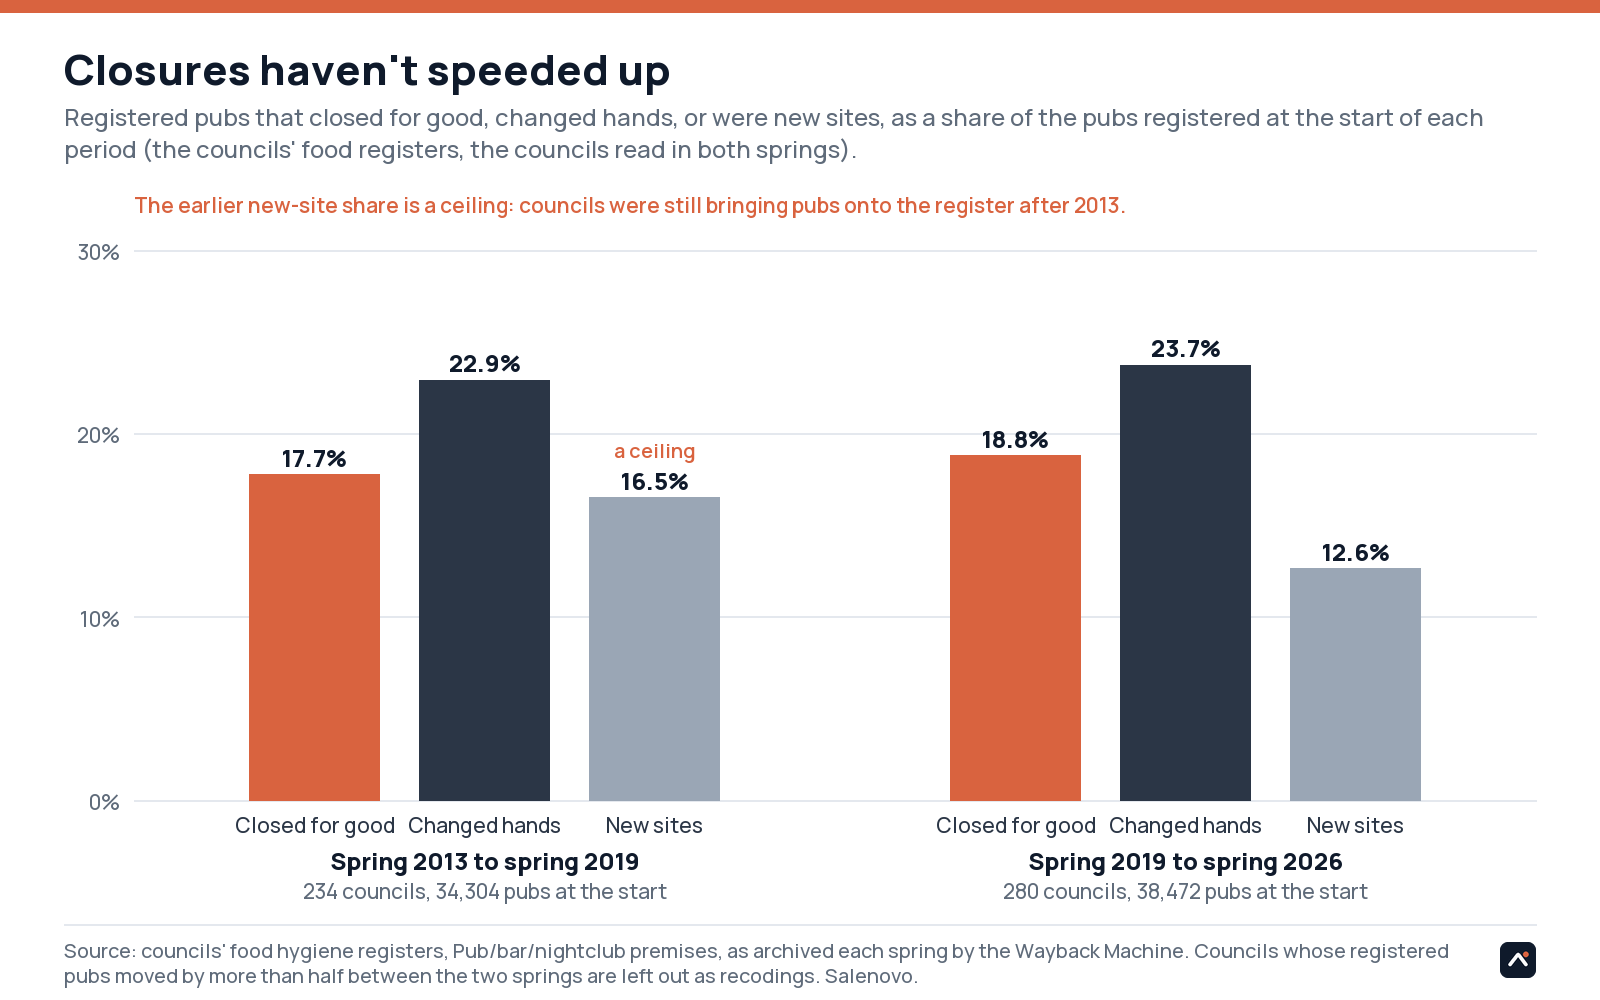
The UK has a sixth fewer pub sites than in 2010, and the number has fallen no faster since 2019 than in the six years before. On the councils' food registers, about one registered pub in five closed for good, leaving no pub registered at its postcode, both in the six years to 2019 and in the seven since.
What "no faster" means here. On the food registers, 17.7% of registered pubs closed for good from spring 2013 to spring 2019 and 18.8% from spring 2019 to spring 2026. Over two spans of equal length it was 17.7% in the six years to 2019 and 16.7% in the six to 2025. That doesn't mean closures have slowed: the three springs from 2022 to 2025 closed 11.1% of registered pubs for good, the same as the three from 2013 to 2016 (11.1%).
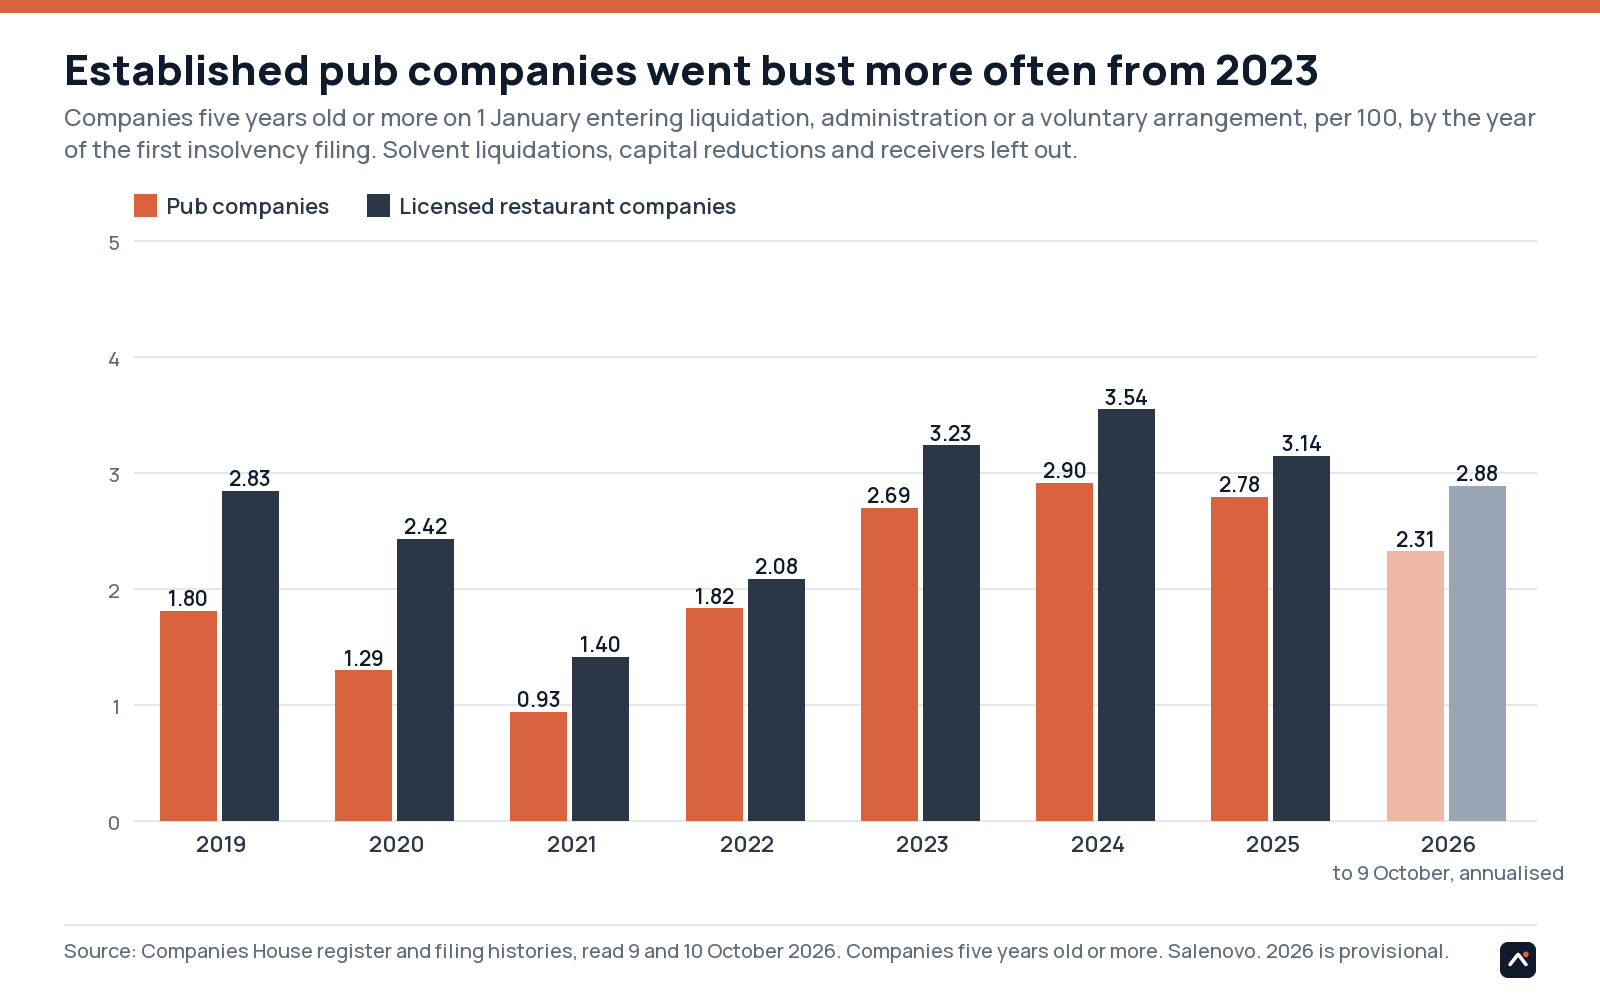
What has changed is how often the established companies that run pubs go bust, about half as often again in 2023 to 2025 as in 2019, and who runs pubs: four in five sites are now run by a company, against two in three in 2019.
The closure counts in the headlines are something else again. The British Beer and Pub Association, the source of the "pub a day" headlines, said on 12 October 2026 that 295 pubs had shut in Britain by the end of September 2026, that about 360 would by the end of the year, and that net closures in 2025 were 336; its page doesn't say how those are counted. None of the counts in this piece is that one. ONS counts sites registered for VAT or PAYE, so a pub that changes hands can leave and come back; the food register counts registrations, and this piece keeps the ones that closed for good apart from the ones that changed hands; Companies House counts companies, which can dissolve while the pub carries on. So none of them is set beside the BBPA's as if it measured the same thing. Altus Group's counts of pubs demolished or converted in England and Wales, quoted in earlier years, are no longer on its own site, so they aren't used here.
How many pubs there are
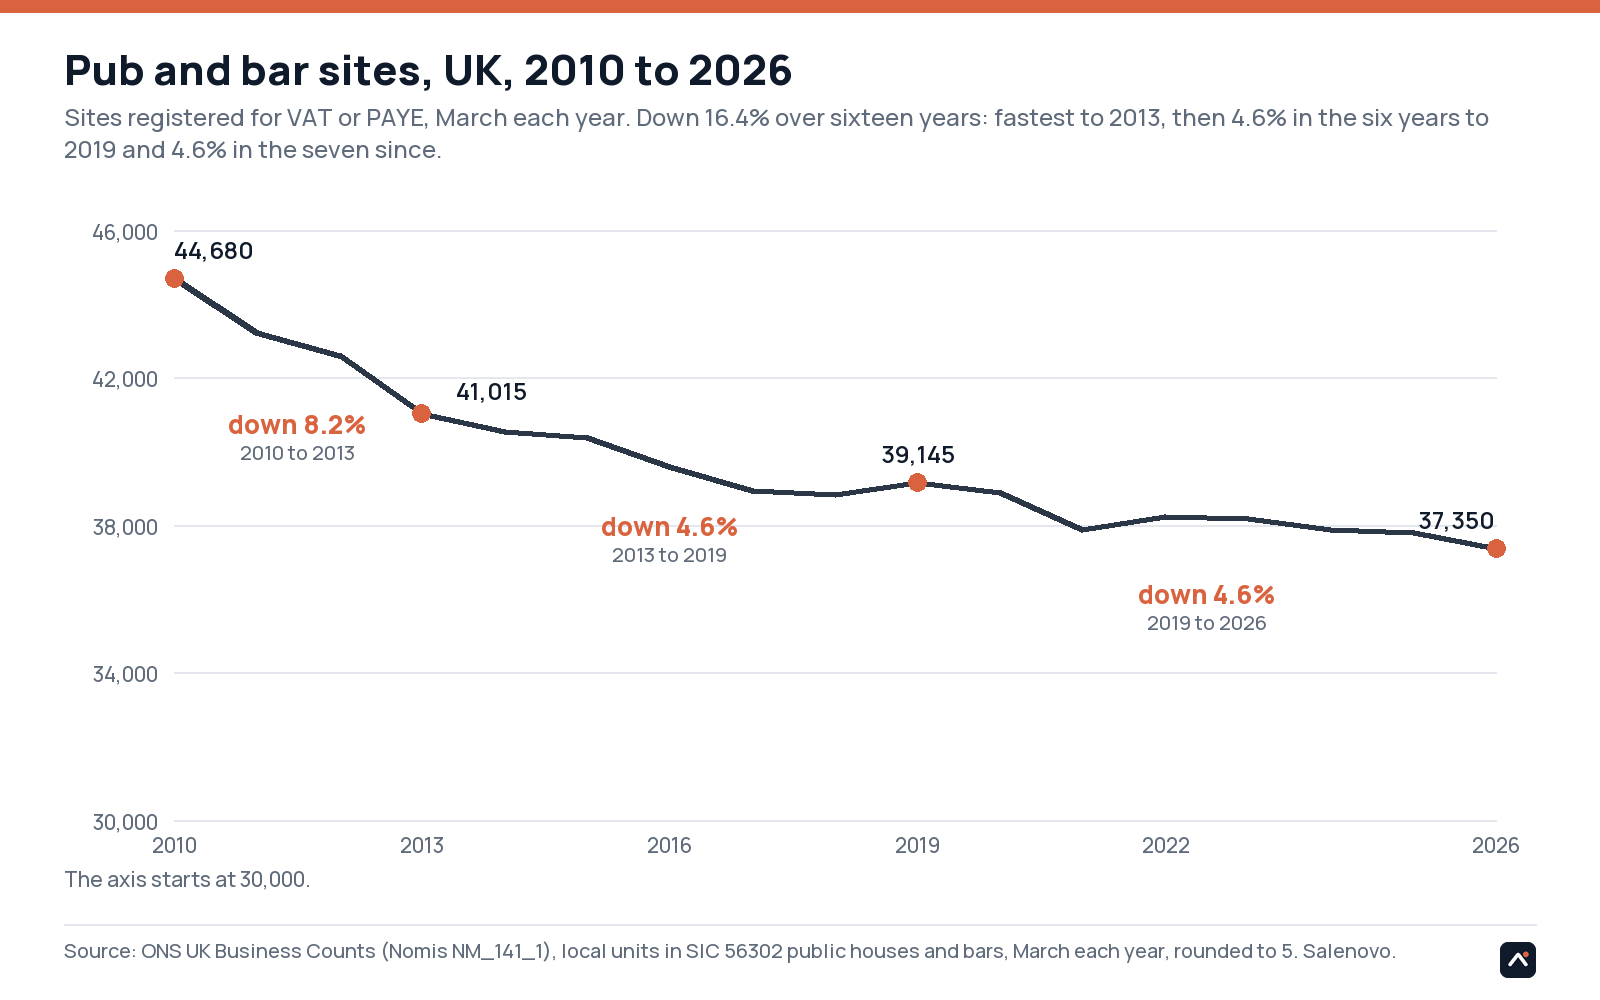
ONS counts every pub and bar site registered for VAT or PAYE each March. There were 44,680 in 2010, 41,015 in 2013, 39,145 in 2019 and 37,350 in 2026: down 16.4% over the sixteen years. The fall was fastest at the start, down 8.2% in the three years to 2013. Since then it has been down 4.6% in the six years to 2019 and down 4.6% in the seven since, so the pace since 2019 is the same as before it.
The nations differ. From 2019 to 2026 England went from 33,305 sites to 32,060 (down 3.7%), Scotland from 2,855 to 2,540 (down 11.0%), Wales from 2,190 to 2,005 (down 8.4%) and Northern Ireland from 790 to 745 (down 5.7%). Since 2010 England is down 15.1%, Scotland down 21.0%, Wales down 26.3% and Northern Ireland down 22.8%. Licensed restaurant sites went the other way over the same seven years, from 35,105 to 38,735 (up 10.3%).
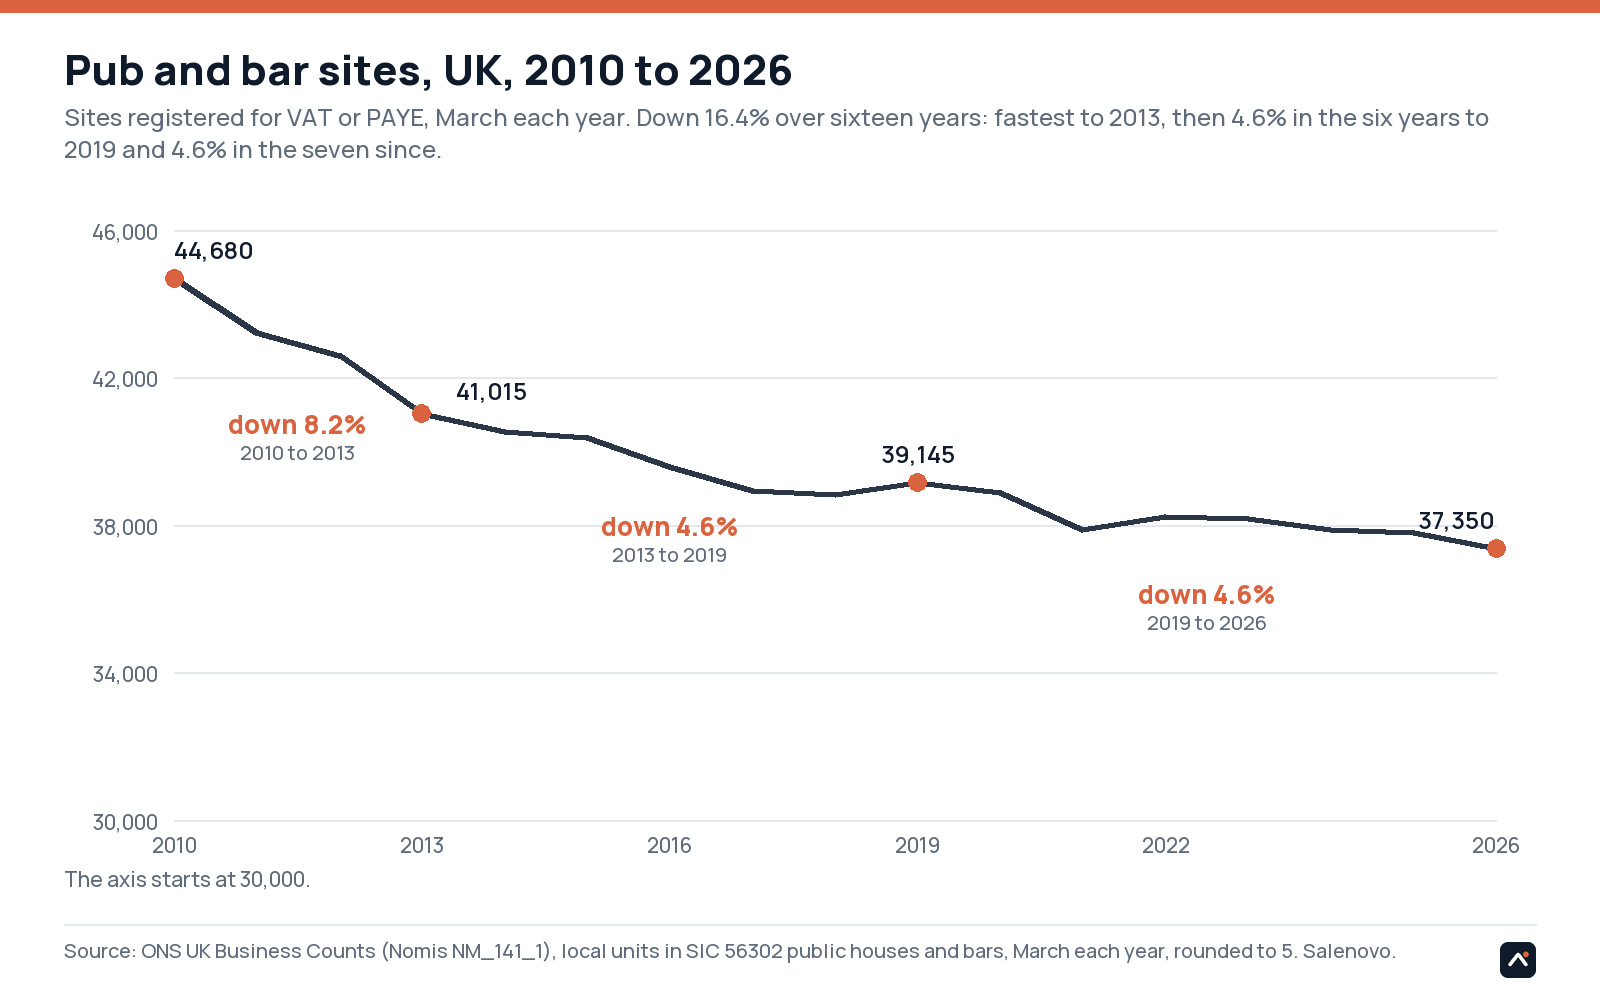
| Pub and bar sites (ONS) | March 2010 | March 2013 | March 2019 | March 2026 | 2010 to 2026 | 2019 to 2026 |
|---|---|---|---|---|---|---|
| United Kingdom | 44,680 | 41,015 | 39,145 | 37,350 | down 16.4% | down 4.6% |
| England | 37,775 | 34,670 | 33,305 | 32,060 | down 15.1% | down 3.7% |
| Scotland | 3,215 | 3,025 | 2,855 | 2,540 | down 21.0% | down 11.0% |
| Wales | 2,720 | 2,440 | 2,190 | 2,005 | down 26.3% | down 8.4% |
| Northern Ireland | 965 | 880 | 790 | 745 | down 22.8% | down 5.7% |
ONS UK Business Counts, local units in SIC 56302 (public houses and bars) registered for VAT or PAYE, March each year, rounded to 5 by ONS; every council, constituency and region is in the downloads.
The people who work in them
ONS's Business Register and Employment Survey counts employees, the people on a payroll, by trade each year. In Great Britain pubs and bars had 422,000 employees in 2015, 441,000 in 2019 and 470,000 in 2024; the count was highest in 2022, at 529,000. Counting working owners as well, employment in pubs and bars went from 453,000 in 2019 to 477,000 in 2024.
The nearest part of the supply chain, measured the same way: beer making had 16,000 employees in 2019 and 21,000 in 2024, malting 1,500 and 1,500, and the wholesale of wine, beer and spirits 26,000 and 26,000. These are the people employed in those trades, nothing more: no estimate of jobs that depend on pubs is made or used here.
| Great Britain (ONS BRES) | Employees 2015 | Employees 2019 | Employees 2024 | Employment 2019 | Employment 2024 |
|---|---|---|---|---|---|
| Public houses and bars (56302) | 422,000 | 441,000 | 470,000 | 453,000 | 477,000 |
| Manufacture of beer (11050) | 14,000 | 16,000 | 21,000 | 17,000 | 22,000 |
| Manufacture of malt (11060) | 1,250 | 1,500 | 1,500 | 1,500 | 1,500 |
| Wholesale of wine, beer, spirits and other alcoholic drinks (46342) | 23,000 | 26,000 | 26,000 | 26,000 | 26,000 |
ONS Business Register and Employment Survey, Great Britain, rounded by ONS (Nomis dataset NM_189_1). Employees are people on a payroll; employment adds working owners. It counts jobs, not hours or pay, and 2024 is the latest year published.
Jobs and sites come from different ONS surveys for different places and years: jobs for Great Britain to 2024, sites for the UK to 2026. More employees doesn't by itself mean pubs are doing well: it counts jobs, not hours or pay.
Closures haven't speeded up
The food register counts something else: premises registered with their council as a pub, bar or nightclub. Each council's register was archived by the Wayback Machine every spring, so two springs can be compared council by council. A pub has closed for good when its registration ended and no pub was registered at the same postcode by the later spring. Where a registration ended but a pub was still registered at the postcode, it has changed hands: a new operator usually means a new registration, so these are counted apart and never added to the closures. A new site is a registration at a postcode that had no pub before.
Between spring 2013 and spring 2019, 17.7% of the 34,304 pubs registered in 234 councils closed for good (6,084 pubs). Between spring 2019 and spring 2026, 18.8% of 38,472 in 280 councils did (7,219). That's about one registered pub in five in each period, and the same share before and after 2019. More changed hands than closed: 7,853 in the first period and 9,128 in the second. Over exactly the same councils, ONS's count of pub sites fell 4.8% and then 4.2%.
New sites made up 16.5% of the 2013 pubs and 12.6% of the 2019 pubs. The earlier figure is a ceiling: councils were still bringing pubs onto the register after 2013, and a pub registered for the first time looks like a new one. So this piece draws no conclusion from the difference.
| Food register, UK | Councils read | Registered pubs at the start | Closed for good | Share | Changed hands | New sites | Share | ONS sites, same councils |
|---|---|---|---|---|---|---|---|---|
| Spring 2013 to spring 2019 | 234 of 361 | 34,304 | 6,084 | 17.7% | 7,853 | 5,651 | 16.5% | down 4.8% |
| Spring 2019 to spring 2026 | 280 of 361 | 38,472 | 7,219 | 18.8% | 9,128 | 4,856 | 12.6% | down 4.2% |
Councils whose registered pubs rose or fell by more than half between the two springs are left out as recodings, not openings or closures (42 councils for 2013 to 2019, 9 for 2019 to 2026). The same table with every council read in both springs, so the cut is visible:
| Every council read (recodings left in) | Councils read | Registered pubs at the start | Closed for good | Share | Changed hands | ONS sites, same councils |
|---|---|---|---|---|---|---|
| Spring 2013 to spring 2019 | 276 of 361 | 36,810 | 6,808 | 18.5% | 8,584 | down 4.5% |
| Spring 2019 to spring 2026 | 289 of 361 | 39,019 | 7,389 | 18.9% | 9,280 | down 4.3% |
The 2013 to 2019 new-site share is a ceiling in both tables: councils were still bringing pubs onto the register after 2013, and a pub registered for the first time looks like a new one.
More pub companies, fewer pubs
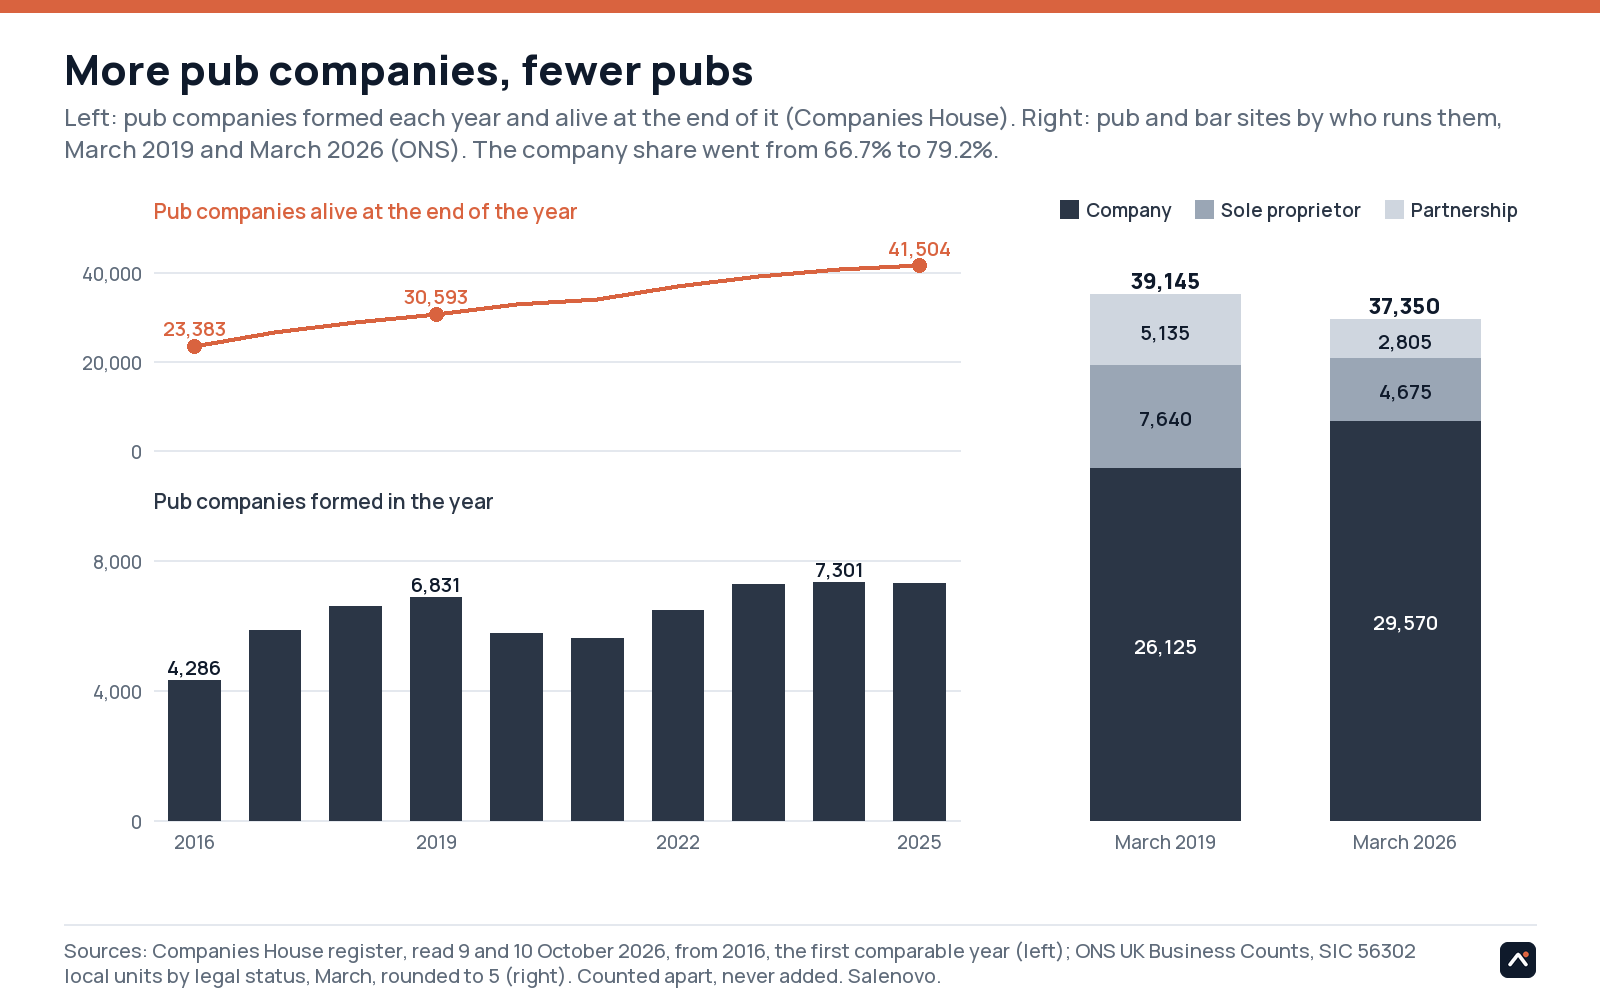
On the Companies House register, more pub companies were formed in each of 2023, 2024 and 2025 than in any year since 2016, when the count becomes comparable: 7,261, 7,301 and 7,267, against 5,822 in 2017 and 6,831 in 2019. By 9 October 2026, 5,375 had been formed this year (provisional). The number of live pub companies went from 30,593 at the end of 2019 to 42,001 on 9 October 2026, up 37%, while ONS's count of pub sites fell 4.6%.
More pub companies doesn't mean more pubs. ONS splits pub and bar sites by who runs them: companies ran 26,125 of 39,145 in March 2019 (66.7%) and 29,570 of 37,350 in March 2026 (79.2%), while sole proprietors' sites went from 7,640 to 4,675 (down 38.8%) and partnerships' from 5,135 to 2,805 (down 45.4%). Four in five pub sites are now run by a company. So company-run sites rose by 3,445 while sole traders' and partnerships' fell by 5,295: part of the rise in pub companies is pubs moving into companies. The rest, most of the 11,408 extra live companies, are companies that run no pub of their own, or one of several behind one pub.
Not every pub company runs a pub. Of the pub companies formed in 2025 at their own address and still on the register, 42.4% have a pub, bar or nightclub on today's food register at their postcode, a floor, since a registered office is often an accountant's or the owner's home. And many never get going: 2,364 of the 6,353 pub companies dissolved in 2025 were under two years old. That's why every figure on companies going bust below is for companies five years old or more.
| Companies (Companies House) | Pub companies formed | Dissolved | Of which under two years old | Alive at year end | Licensed restaurant companies formed | Dissolved | Alive at year end |
|---|---|---|---|---|---|---|---|
| 2019 | 6,831 | 4,921 | 2,173 | 30,593 | 9,712 | 7,175 | 42,344 |
| 2020 | 5,741 | 3,687 | 1,269 | 32,647 | 8,278 | 5,463 | 45,159 |
| 2021 | 5,591 | 4,363 | 1,955 | 33,875 | 7,702 | 5,849 | 47,012 |
| 2022 | 6,460 | 3,585 | 1,480 | 36,750 | 8,810 | 5,302 | 50,520 |
| 2023 | 7,261 | 5,016 | 2,243 | 38,995 | 10,457 | 6,887 | 54,090 |
| 2024 | 7,301 | 5,706 | 2,457 | 40,590 | 11,257 | 7,883 | 57,464 |
| 2025 | 7,267 | 6,353 | 2,364 | 41,504 | 10,204 | 9,443 | 58,225 |
| 2026 (to 9 Oct, provisional) | 5,375 | 4,878 | 1,683 | 42,001 | 7,495 | 6,953 | 58,767 |
Companies whose registered trade is public houses and bars (SIC 56302) or licensed restaurants (56101), any address. 2026 runs to 9 October 2026, and its "alive at year end" is the count on that day. 2020 to 2022 are the registrar's pause on striking off companies during the pandemic and the catch-up after, so compare 2019 with 2023 onwards.
The established companies went bust more often from 2023
A company went bust here when it entered liquidation, administration or a voluntary arrangement with its creditors; solvent liquidations, capital reductions and receivers over property are left out. Dated by the first insolvency filing at Companies House, usually within days of the process starting, pub companies five years old or more on 1 January went bust at 1.80 per 100 in 2019, then 2.69 in 2023, 2.90 in 2024 and 2.78 in 2025 (180, 386, 475 and 525 companies). That's 49%, 61% and 54% above 2019. Licensed restaurant companies went from 2.83 to 3.23, 3.54 and 3.14, between 11% and 25% above 2019. Restaurants still go bust more often; pubs rose further from where they began. In 2026 to 9 October the pub rate is lower than in 2023 to 2025 but still above 2019 (2.31 against 1.80); restaurants' is back at 2019's (2.88 against 2.83). Both are annualised and provisional. 2019 is the only year before the pandemic these records count in full, so it's the one compared with.
Most are creditors' voluntary liquidations, where the directors call in a liquidator: 420 of the 525 pub company entries in 2025. Compulsory winding up, which a creditor asks a court for, was 84 (against 30 in 2019), and administration 12.
| Year of the first insolvency filing | Pub companies five years old or more on 1 Jan | Entered insolvency | Per 100 | Licensed restaurant companies five years old or more | Entered insolvency | Per 100 |
|---|---|---|---|---|---|---|
| 2019 | 9,991 | 180 | 1.80 | 13,376 | 379 | 2.83 |
| 2020 | 10,816 | 139 | 1.29 | 14,224 | 344 | 2.42 |
| 2021 | 11,758 | 109 | 0.93 | 15,191 | 213 | 1.40 |
| 2022 | 12,783 | 233 | 1.82 | 16,515 | 343 | 2.08 |
| 2023 | 14,356 | 386 | 2.69 | 18,745 | 605 | 3.23 |
| 2024 | 16,359 | 475 | 2.90 | 21,601 | 764 | 3.54 |
| 2025 | 18,863 | 525 | 2.78 | 25,471 | 799 | 3.14 |
| 2026 (to 9 Oct, annualised, provisional) | 19,565 | 348 | 2.31 | 26,722 | 592 | 2.88 |
Companies House filing histories: the first liquidation, administration or voluntary arrangement in each history, dated by the first insolvency filing; members' (solvent) liquidations, capital reductions and receivers left out, and only companies five years old or more on 1 January counted, the same companies as the first column. Every pub and every licensed restaurant company that dissolved from 2019 or was in a process on 9 October 2026 was read, so the two together miss no entry from 2019 on.
Going bust is one of three ways established pub companies leave the register. Of the 9,568 that dissolved from 2019 to 9 October 2026, 34.5% were struck off at their directors' request, 32.9% went through an insolvency, 30.0% were struck off by the registrar for not filing and 2.7% were wound up solvent. So about a third went bust, a third simply stopped, and a third stopped filing. Counted by the year a company was dissolved, which comes one to two years after an insolvency begins, established pub companies left the register at 9.4 per 100 in 2019, 7.9 in 2025 and 9.5 in 2026 to 9 October (annualised, provisional), 2.87, 3.24 and 3.65 of them through insolvency. That series runs behind the one above, which is why its 2026 is the highest of the years while the entries' 2026 isn't.
| Year dissolved | Pub companies five years old or more on 1 Jan | Dissolved | Per 100 | Insolvency | Struck off by the registrar | Directors applied | Solvent liquidation |
|---|---|---|---|---|---|---|---|
| 2019 | 9,991 | 935 | 9.4 | 2.87 | 2.72 | 3.46 | 0.30 |
| 2020 | 10,816 | 856 | 7.9 | 2.27 | 2.10 | 3.37 | 0.18 |
| 2021 | 11,758 | 844 | 7.2 | 2.12 | 2.55 | 2.29 | 0.22 |
| 2022 | 12,783 | 769 | 6.0 | 1.90 | 1.41 | 2.50 | 0.20 |
| 2023 | 14,356 | 999 | 7.0 | 1.92 | 2.12 | 2.81 | 0.11 |
| 2024 | 16,359 | 1,094 | 6.7 | 2.59 | 1.50 | 2.33 | 0.28 |
| 2025 | 18,863 | 1,482 | 7.9 | 3.24 | 1.97 | 2.26 | 0.38 |
| 2026 (to 9 Oct, annualised, provisional) | 19,565 | 1,427 | 9.5 | 3.65 | 2.80 | 2.87 | 0.15 |
Per 100 established pub companies alive on 1 January, by the year the company left the register and how it left (the registrar's label on the final notice and the forms before it), every address. A dissolution comes one to two years after an insolvency begins, so this series runs behind the one above.
New pub companies tell the same story at equal age. Of those formed in 2019, 75.5% were still registered at two years, 64.9% at three and 55.3% at five, the most at five years of any year's intake since 2016. Of those formed in 2022, 65.0% were left at two years and 48.2% at three, the fewest at three years since 2016. Licensed restaurant companies follow the same pattern, a few points higher: 69.3% of the 2019 intake at three years, 50.1% of 2022's.
What changed, and what the figures can't say
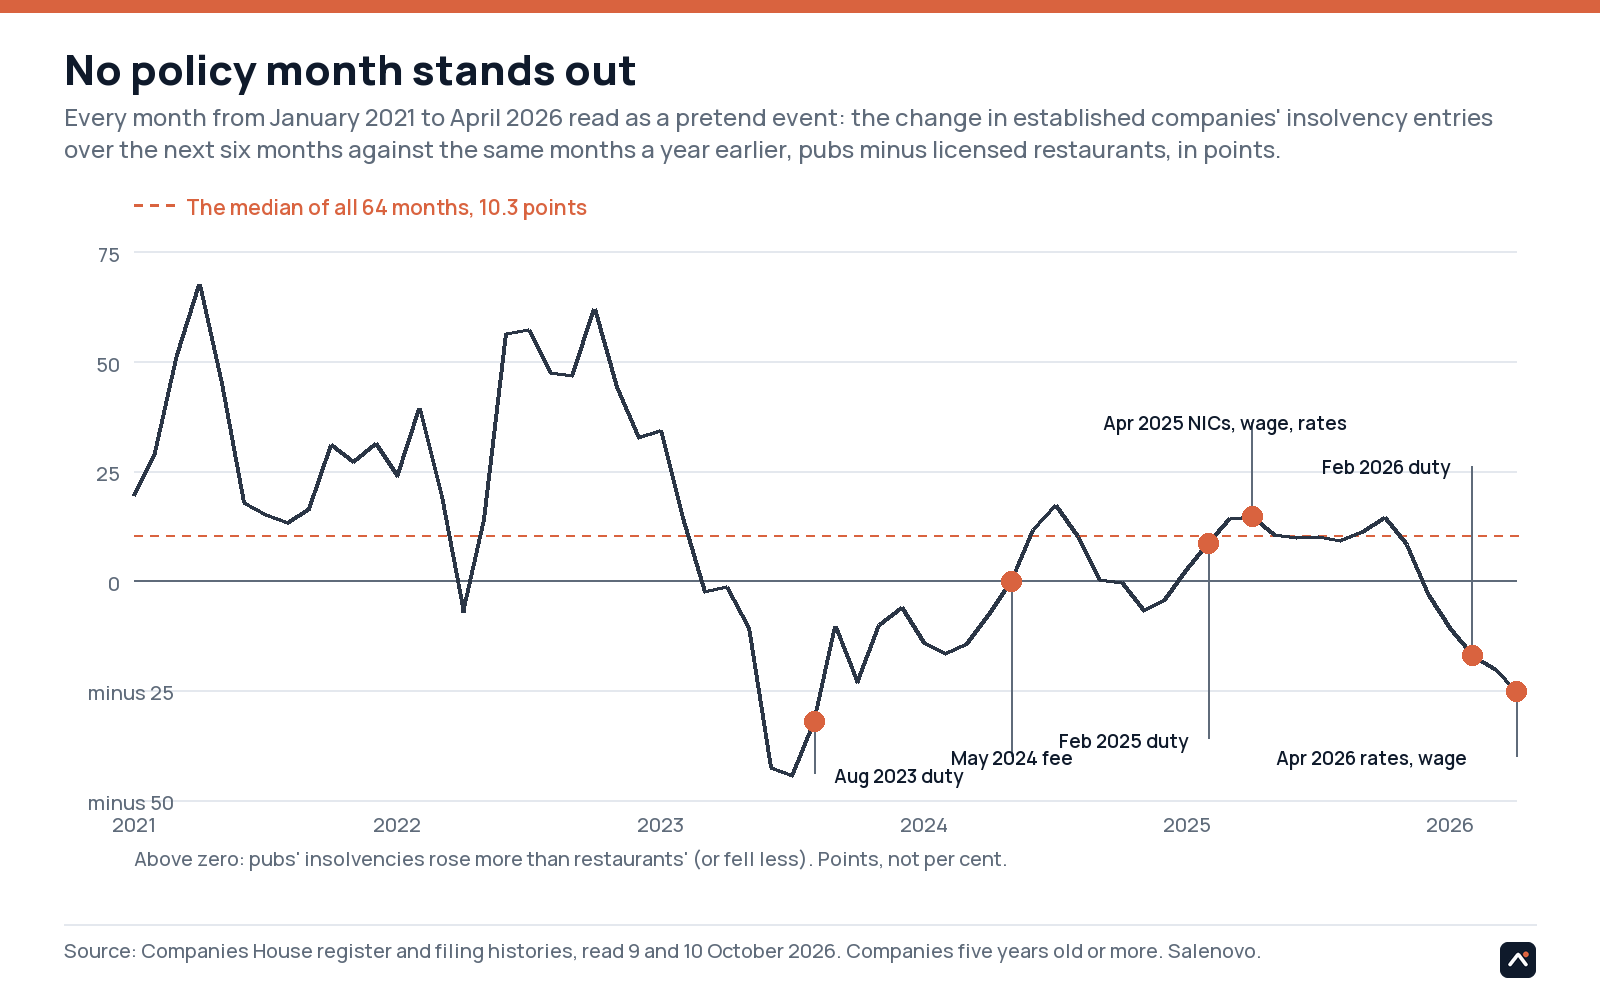
Several things changed for pubs and restaurants in these years. The table names each one with its source, and puts beside it how pub and restaurant companies' insolvencies moved over the next six months, against the same months a year before. Then it does the same for every other month from January 2021, as if each were an event, to show how big a gap turns up when nothing in particular happened.
| What changed | Source | Pub companies' insolvency entries, next six months on a year earlier | Licensed restaurants' | Gap, pubs against restaurants | Where the gap sits among all 64 months |
|---|---|---|---|---|---|
| 1 August 2023: alcohol duty charged by strength, with a relief for draught | gov.uk, Reform of alcohol duty rates and reliefs | up 17.9% | up 50.0% | 32.2 points the other way | higher than 3% of months |
| 1 May 2024: Companies House incorporation fee from £12 to £50 | legislation.gov.uk, SI 2024/155 | down 3.6% | down 3.4% | 0.2 points the other way | higher than 36% of months |
| 1 February 2025: alcohol duty up with RPI, draught rates cut 1.7% | gov.uk, Changes to the rates of Alcohol Duty | down 4.4% | down 12.8% | 8.4 points | higher than 42% of months |
| April 2025: employer National Insurance 15% with a £5,000 threshold (6 April), National Living Wage £12.21, and in England retail, hospitality and leisure rates relief cut from 75% to 40% (1 April) | gov.uk | up 1.4% | down 13.2% | 14.6 points | higher than 62% of months |
| 1 February 2026: alcohol duty up 3.66% with RPI, draught included | gov.uk, Alcohol Duty uprating | down 22.7% | down 5.7% | 17.0 points the other way | higher than 9% of months |
| April 2026: in England the rates revaluation, lower multipliers for hospitality and a 15% relief for pubs; National Living Wage £12.71 | gov.uk | down 27.5% | down 2.3% | 25.2 points the other way | higher than 5% of months |
Established companies (five years old or more) entering insolvency in the six months from each date, against the same six months a year earlier, as a rate. Every month from January 2021 to April 2026 was run the same way as a pretend event: the median gap is 10.3 points and the middle 80% of months run from 16.9 points the other way to 46.2 points. The six months from April 2026 run to September 2026, the last full month read. Business rates reliefs are England's; Wales, Scotland and Northern Ireland set their own.
Both trades' insolvencies rose through 2023 to 2025. Read beside every other month since January 2021, none of these dates stands out as worse for pubs than for restaurants. Three sit among the lowest fifth of all the months, where restaurants' insolvencies rose more than pubs' or fell less (August 2023, 32.2 points the other way; February 2026, 17.0 points the other way; April 2026, 25.2 points the other way), and the rest sit in the middle (April 2025, 14.6 points, higher than 62% of months). So the data can't say which measure, if any, is responsible for pubs' share of the rise.
Where
Region by region, the food register tells the same story as the UK. Between 2019 and 2026 the share of registered pubs that closed for good ran from 15.3% in Scotland to 23.5% in London, and in every area read well enough to rely on it was between 15% and 24% in both periods. For the 17 London boroughs we could read in both periods, the share went from 19.4% to 23.0%, and London is also where the register and ONS disagree: the register's count for the 20 boroughs read fell 13.1% while ONS's rose 4.8%. The new-site shares fell most in Wales (29.9% to 12.3%) and the North East (19.9% to 7.8%), which look like places where the register was still filling in after 2013, so they're shown and not read as a fall in openings.
| Food register, 2019 to 2026 | Councils read | Their share of the area's ONS sites | Registered pubs, spring 2019 | Closed for good | Changed hands | New sites | Registered pubs, change | ONS sites, same councils | 2013 to 2019, same cut |
|---|---|---|---|---|---|---|---|---|---|
| England | 231 of 296 | 69% | 31,607 | 5,986 (18.9%) | 8,012 | 4,182 (13.2%) | down 5.7% | down 3.3% | 18.0% closed, 15.9% new (a ceiling) |
| Wales | 18 of 22 | 85% | 2,943 | 623 (21.2%) | 553 | 361 (12.3%) | down 9.4% | down 7.0% | 16.6% closed, 29.9% new (a ceiling) |
| Scotland | 21 of 32 | 61% | 2,858 | 436 (15.3%) | 377 | 226 (7.9%) | down 7.9% | down 12.3% | too few to rely on |
| Northern Ireland | 10 of 11 | 96% | 1,064 | 174 (16.4%) | 186 | 87 (8.2%) | down 12.0% | down 5.9% | not read |
| North East | 10 of 12 | 81% | 2,297 | 360 (15.7%) | 455 | 179 (7.8%) | down 8.3% | down 6.9% | 15.4% closed, 19.9% new (a ceiling) |
| North West | 25 of 35 | 67% | 4,200 | 849 (20.2%) | 760 | 708 (16.9%) | down 3.4% | down 0.7% | 19.8% closed, 16.2% new (a ceiling) |
| Yorkshire and the Humber | 11 of 15 | 60% | 3,467 | 653 (18.8%) | 591 | 441 (12.7%) | down 5.5% | up 1.4% | too few to rely on |
| East Midlands | 29 of 35 | 75% | 3,265 | 555 (17.0%) | 891 | 416 (12.7%) | down 3.5% | down 4.5% | 16.6% closed, 12.4% new (a ceiling) |
| West Midlands | 25 of 30 | 78% | 3,705 | 711 (19.2%) | 1,536 | 546 (14.7%) | down 3.5% | down 5.4% | 19.2% closed, 15.6% new (a ceiling) |
| East of England | 39 of 45 | 86% | 4,008 | 806 (20.1%) | 1,169 | 528 (13.2%) | down 7.4% | down 6.8% | 20.4% closed, 15.8% new (a ceiling) |
| London | 20 of 33 | 56% | 2,551 | 600 (23.5%) | 576 | 287 (11.3%) | down 13.1% | up 4.8% | 18.1% closed, 11.8% new (a ceiling) |
| South East | 54 of 64 | 78% | 5,551 | 971 (17.5%) | 1,354 | 700 (12.6%) | down 5.1% | down 5.4% | 17.6% closed, 15.4% new (a ceiling) |
| South West | 18 of 27 | 48% | 2,563 | 481 | 680 | 377 | down 4.6% | down 4.1% | 17.7% closed, 17.4% new (a ceiling); 2019 to 2026 too few to rely on, counts only |
Recodings left out, as in the UK table. An area is flagged "too few to rely on" when the councils read hold under half of its ONS pub sites or number fewer than five, and its row is given as counts. The register and ONS sometimes disagree on direction for the same councils; where they do, both are shown and neither is preferred.
On the Companies House register, where a pub company is registered tells you something about new companies and less about established ones (England only). Of the pub companies formed from 2019 to September 2023 and followed for three years, 52.1% of the 3,566 formed in the most deprived tenth of areas were gone against 37.0% of the 1,207 in the least deprived; licensed restaurants 46.0% and 39.4%. For established pub companies at their own address, the share that left the register in 2025 ran from 4.9 to 8.2 per 100 across the ten deciles with no pattern, so in 2025 where an established pub company was didn't predict whether it lasted. 2023 was different: 8.4 per 100 in the most deprived tenth, 4.7 to 7.3 elsewhere.
Rural pub companies left the register less often than urban ones: 4.9 per 100 established pub companies at their own address in 2025 (2,982 companies) against 6.7 (9,428), and 39.9% of new rural pub companies were gone by three years (4,514 formed) against 46.4% (21,473). That's a finding about rural pub companies, not rural pubs: the pubs this lens can't see, run by sole traders or as tenancies, are more often rural.
| IMD 2025 decile of the registered office (England) | Pub companies formed 2019 to Sep 2023 | Gone by three years | Licensed restaurant companies formed | Gone by three years | Established pub companies, 1 Jan 2023 | Left the register in 2023, per 100 | Established pub companies, 1 Jan 2025 | Left the register in 2025, per 100 |
|---|---|---|---|---|---|---|---|---|
| 1 (most deprived) | 3,566 | 52.1% | 4,037 | 46.0% | 802 | 8.4 | 1,145 | 6.8 |
| 2 | 2,802 | 50.5% | 4,045 | 48.1% | 821 | 6.9 | 1,118 | 6.1 |
| 3 | 2,928 | 45.7% | 4,912 | 44.3% | 953 | 7.3 | 1,315 | 6.5 |
| 4 | 3,224 | 46.9% | 5,512 | 44.9% | 1,060 | 5.9 | 1,458 | 6.4 |
| 5 | 2,739 | 43.1% | 4,411 | 40.5% | 1,213 | 4.7 | 1,552 | 6.8 |
| 6 | 2,633 | 47.0% | 3,382 | 41.1% | 1,065 | 6.2 | 1,393 | 5.8 |
| 7 | 2,493 | 40.6% | 3,373 | 38.2% | 1,106 | 5.8 | 1,415 | 5.9 |
| 8 | 2,484 | 40.5% | 3,094 | 39.9% | 1,093 | 6.7 | 1,359 | 4.9 |
| 9 | 1,911 | 40.3% | 2,411 | 41.0% | 768 | 6.2 | 970 | 5.8 |
| 10 (least deprived) | 1,207 | 37.0% | 1,546 | 39.4% | 558 | 7.0 | 685 | 8.2 |
Companies House register, England only (the Index of Multiple Deprivation 2025 is England's). New companies at any address; established companies (five years old or more) at their own address, leaving out addresses shared by ten or more pub companies. A registered office is often an accountant's or the owner's home, so this places the company, not the pub.
No table of councils from the food register or the company register: council by council the register doesn't agree with ONS, and an insolvent company takes its liquidator's address, so the company register can't say where a pub that went bust was. Every council's ONS count of pub and bar sites is in the downloads, and on its own page. Of the 303 councils with 50 or more sites in March 2019, 182 had fewer in March 2026 and 72 more; the median change was down 5.6%.
What these figures can and can't say
Three lenses for pubs, never added, and a fourth count for jobs. The jobs are employees in Great Britain from a different ONS survey, to 2024, so they're never divided by the number of pubs. ONS counts sites registered for VAT or PAYE, rounded to 5, so the smallest pubs are missed. The food register records registrations and operators: a new operator usually means a new registration, which is why "changed hands" is counted apart, and councils remove a closed pub when they notice, so the register lags in both periods; councils code differently, so the register gives the national share and the regional split, and never a council. Companies House counts companies, not pubs: tenancies, sole traders and chain sites are invisible to it, a group dissolving a subsidiary isn't a pub closing, and ONS's split by legal status says how much it sees (four in five sites today, two in three in 2019). Dissolved isn't failed: only the companies that entered an insolvency process are said to have gone bust. The policy dates are context and the pretend months are the test. Nothing here says why any of it happened.
How each count was made is on the method page.
Downloads
Cite this
Free to quote and reproduce with attribution. Suggested form:
To put the chart on your own page, with the credit built in:
The data are ONS, Food Standards Agency (the councils' food hygiene registers) and Companies House material under the Open Government Licence v3.0. A cut for any region or council is available on request: matt@salenovo.com.
Council-by-council survival and trading rates are at /survival/; the method, its accuracy and its agreement with ONS Business Demography at /method/. Every incorporation, weekly, by council: the Formation Index.