Companies started since March 2020 are closing faster than any in the decade before. The ones that last can be spotted early.
Companies formed in 2019 have outlived every other year's since 2010. Everything formed since March 2020 is closing faster. But it isn't random: the companies that last can be told apart in their first days.
Published 3 November 2026 · part of the UK Business Formation Index · free to quote with attribution to Salenovo · how to cite · downloads · for journalists
10.3 million companies formed from January 2010 to September 2025, in 189 monthly cohorts, each measured at the same ages from the Companies House register on 10 October 2026. Companies only. Method and caveats at the foot of the page.
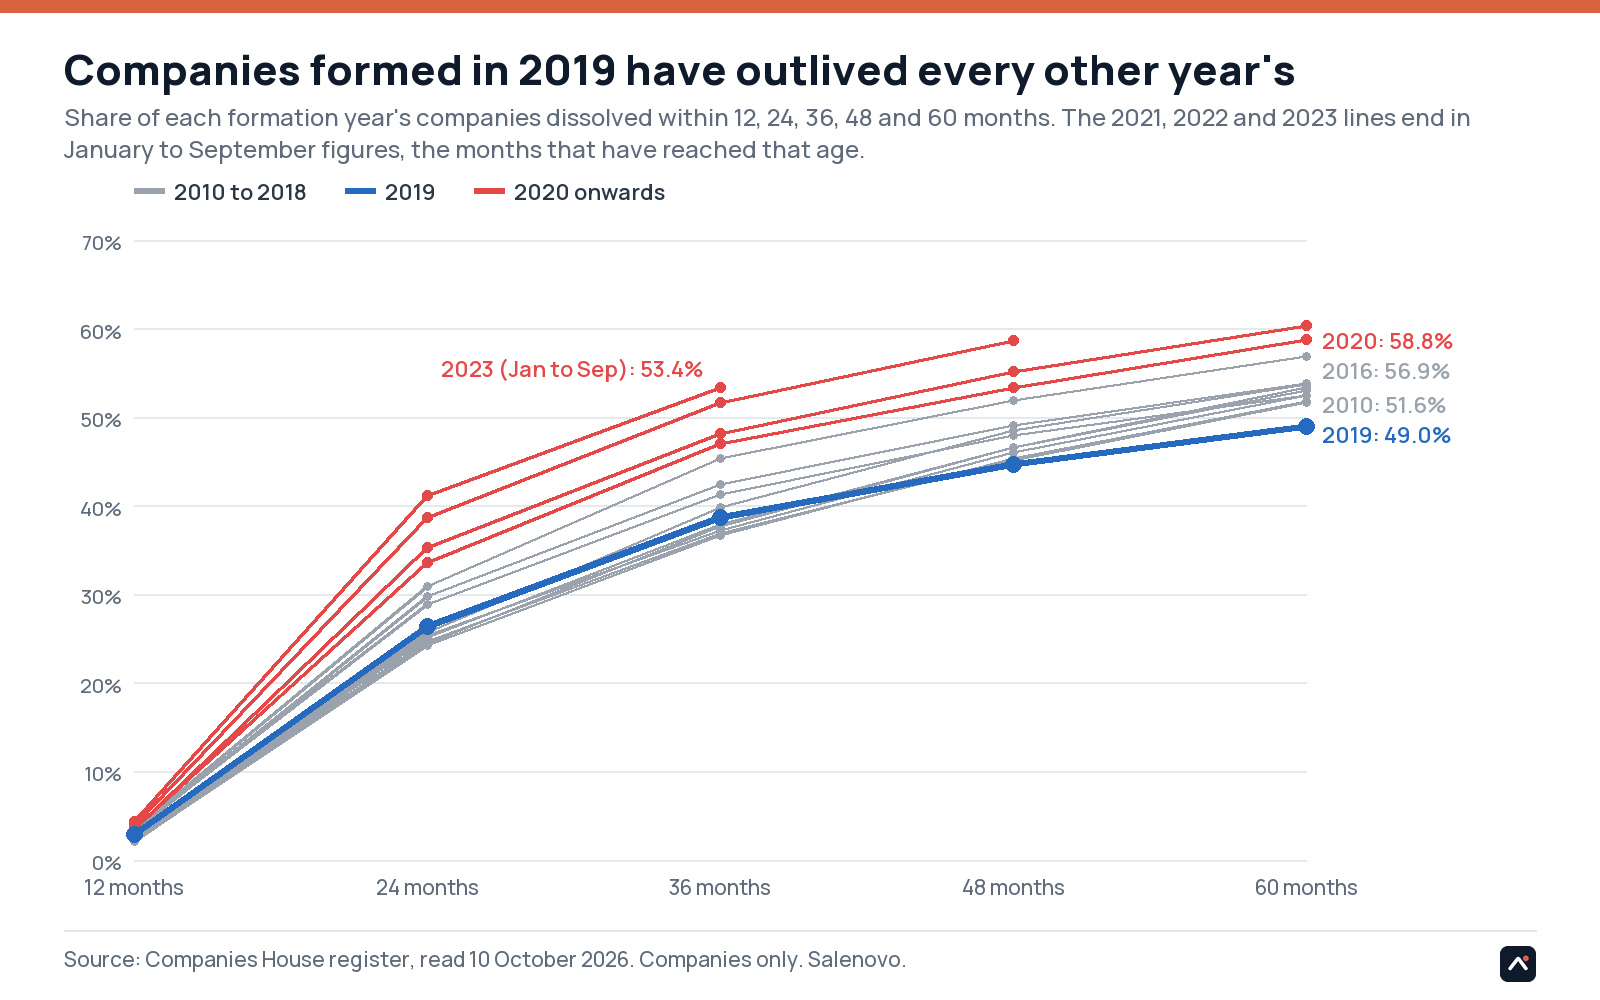
Of the companies formed in 2019, 51% were still on the register five years on, the only year since 2010 above half. Of those formed from April to December 2020, 39%; from January to September 2021, 40%; and the 2022 intake is on course to be worse. The month you start barely matters. The year does.
How to read this
A cohort is every company with an incorporation date in one month. "Gone within 24 months" means dissolved by the end of the 24th month after the formation month, so every company in a cohort is measured at the same age. Dissolved isn't failed: most dissolutions are the registrar striking off companies that stopped filing, typically 18 to 30 months after formation. "Gone" means left the register.
Companies here means companies formed under the Companies Act: private companies limited by shares or by guarantee, unlimited companies and plcs. LLPs, limited partnerships, overseas companies and registered overseas entities are left out, because the register never marks them dissolved.
The best year, and the break
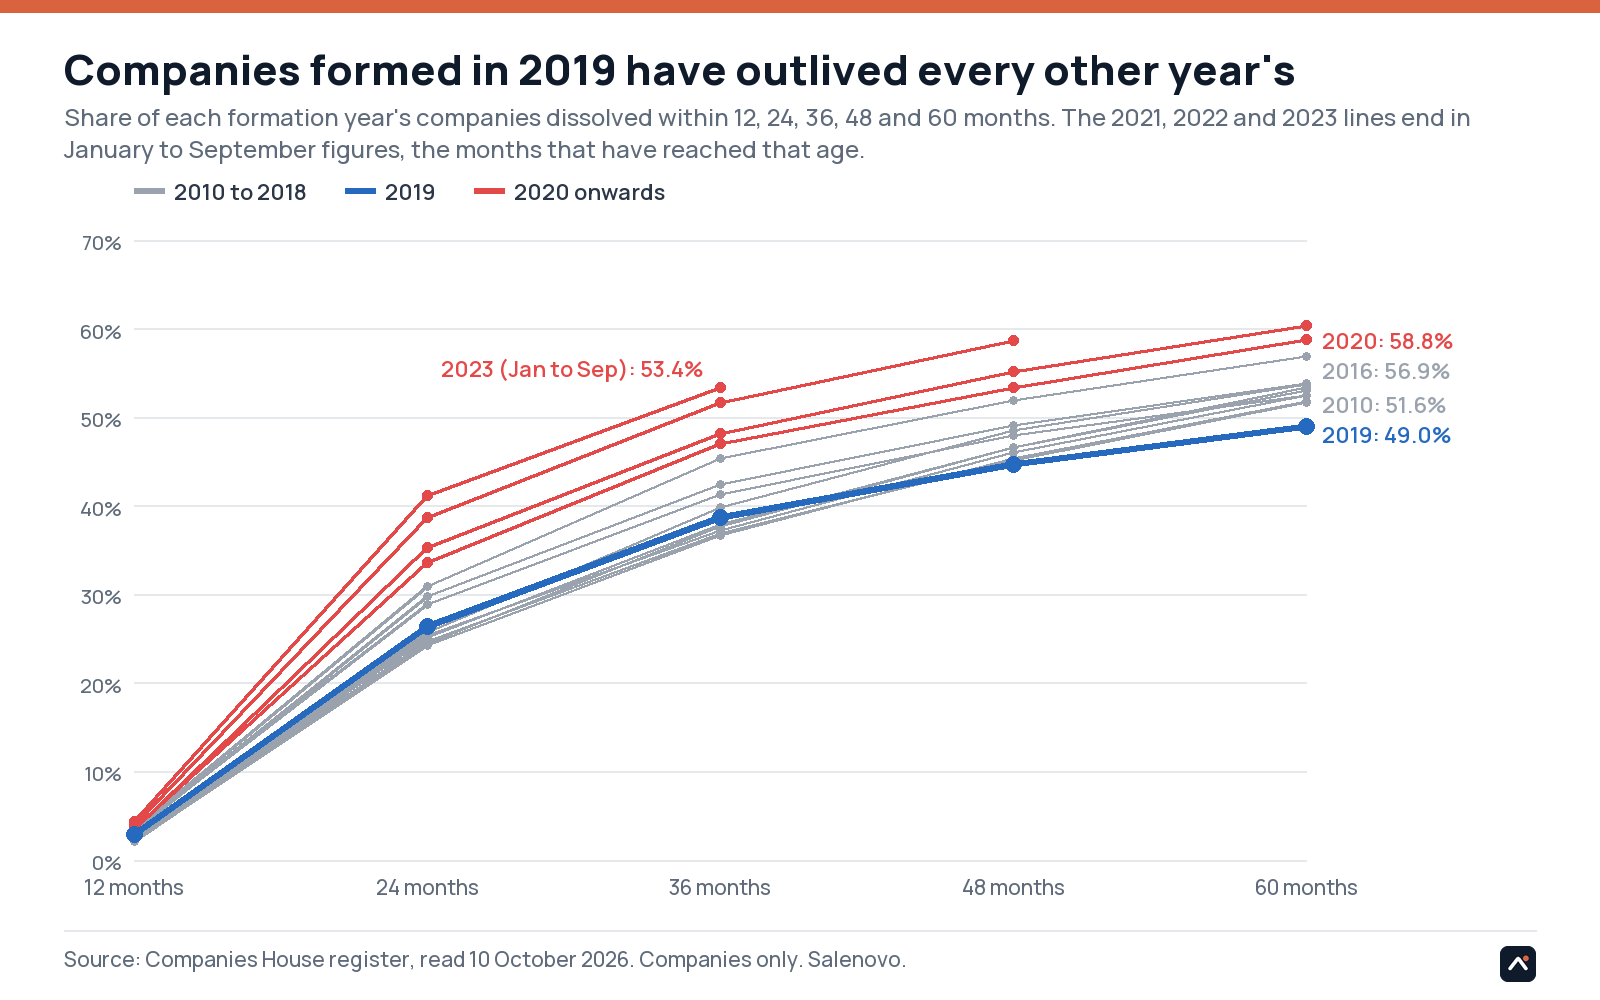
Before 2020 the five-year figure was flat: between 51.6% and 53.8% of every year's companies from 2010 to 2018 had gone within five years, except 2016's (56.9%). The 2019 cohort came in at 49.0%, the best in the series, and its advantage sits in its third to fifth years, after the pandemic strike-off pauses had ended, so it isn't an artefact of them. Then the break: companies formed in January and February 2020 did as well as 2019's; from March 2020 the line drops and stays down.
Of the companies formed in January and February 2020, 47.3% had gone within five years. Of those formed from April to December 2020, 61.3%; from January to September 2021, 60.4%. The 2022 cohorts are already worse at four years (58.7% gone, January to September) than the April to December 2020 cohorts were at the same age (55.6%). The single month with the most gone at five years is May 2020 (63.3%), but August and September 2021 are within a point of it (62.9% and 62.4%). It isn't a lockdown dip that recovered: the line has stayed down since March 2020.
Share of each year's companies gone, by age
Every monthly cohort, January 2010 to September 2024
The decade before 2020
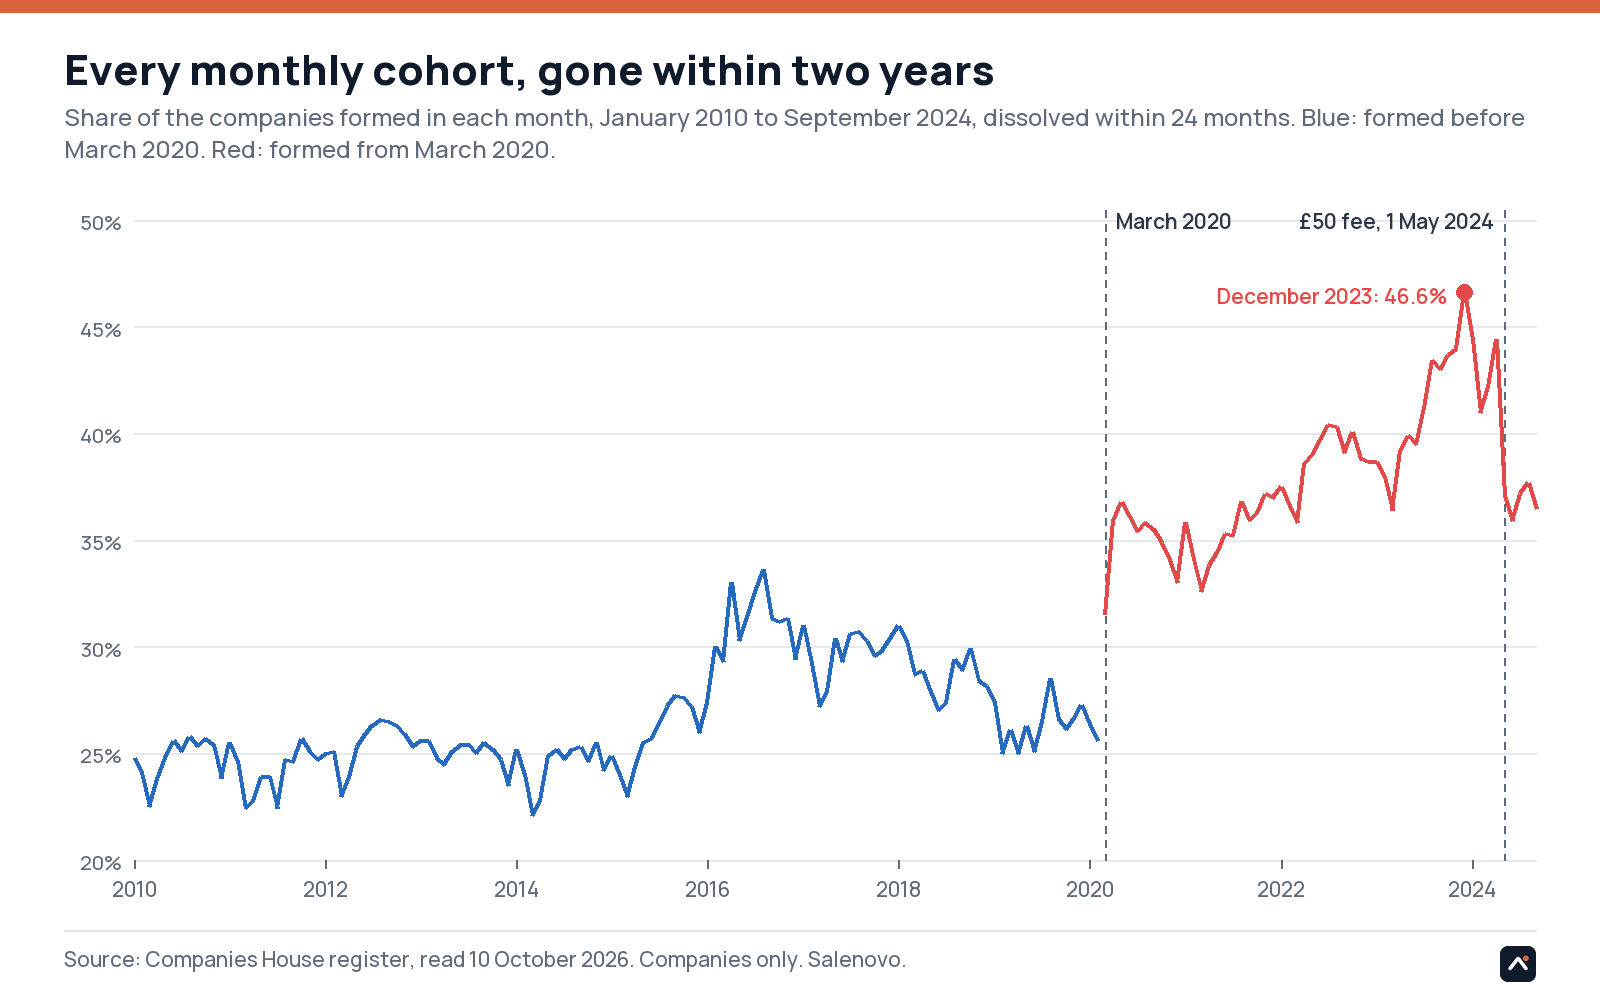
Flat at five years, with one step at two. From 2010 to 2018 between 51.6% and 53.8% of each year's companies had gone within five years, 2016 aside at 56.9%. At two years the line stepped up once, in 2016: 24% to 26% gone for the 2010 to 2015 cohorts, 29% to 31% for 2016 to 2018. The step is concentrated in the February to April 2016 cohorts (29% to 33% gone at two years, against 23% to 24% for the same months of 2015); it settles at about 31% for the rest of 2016 and 29% to 30% for 2017 and 2018. Official dissolutions stepped up at the same time (434,663 in 2016/17, 491,723 in 2017/18, 512,472 in 2018/19), so the registrar's pace, rather than the companies, accounts for part of it. Then came the 2020 step: 34% to 41% gone at two years for the 2020 to 2023 cohorts. The register can say when the 2016 step happened, not why.
Why 2019 isn't a pandemic artefact
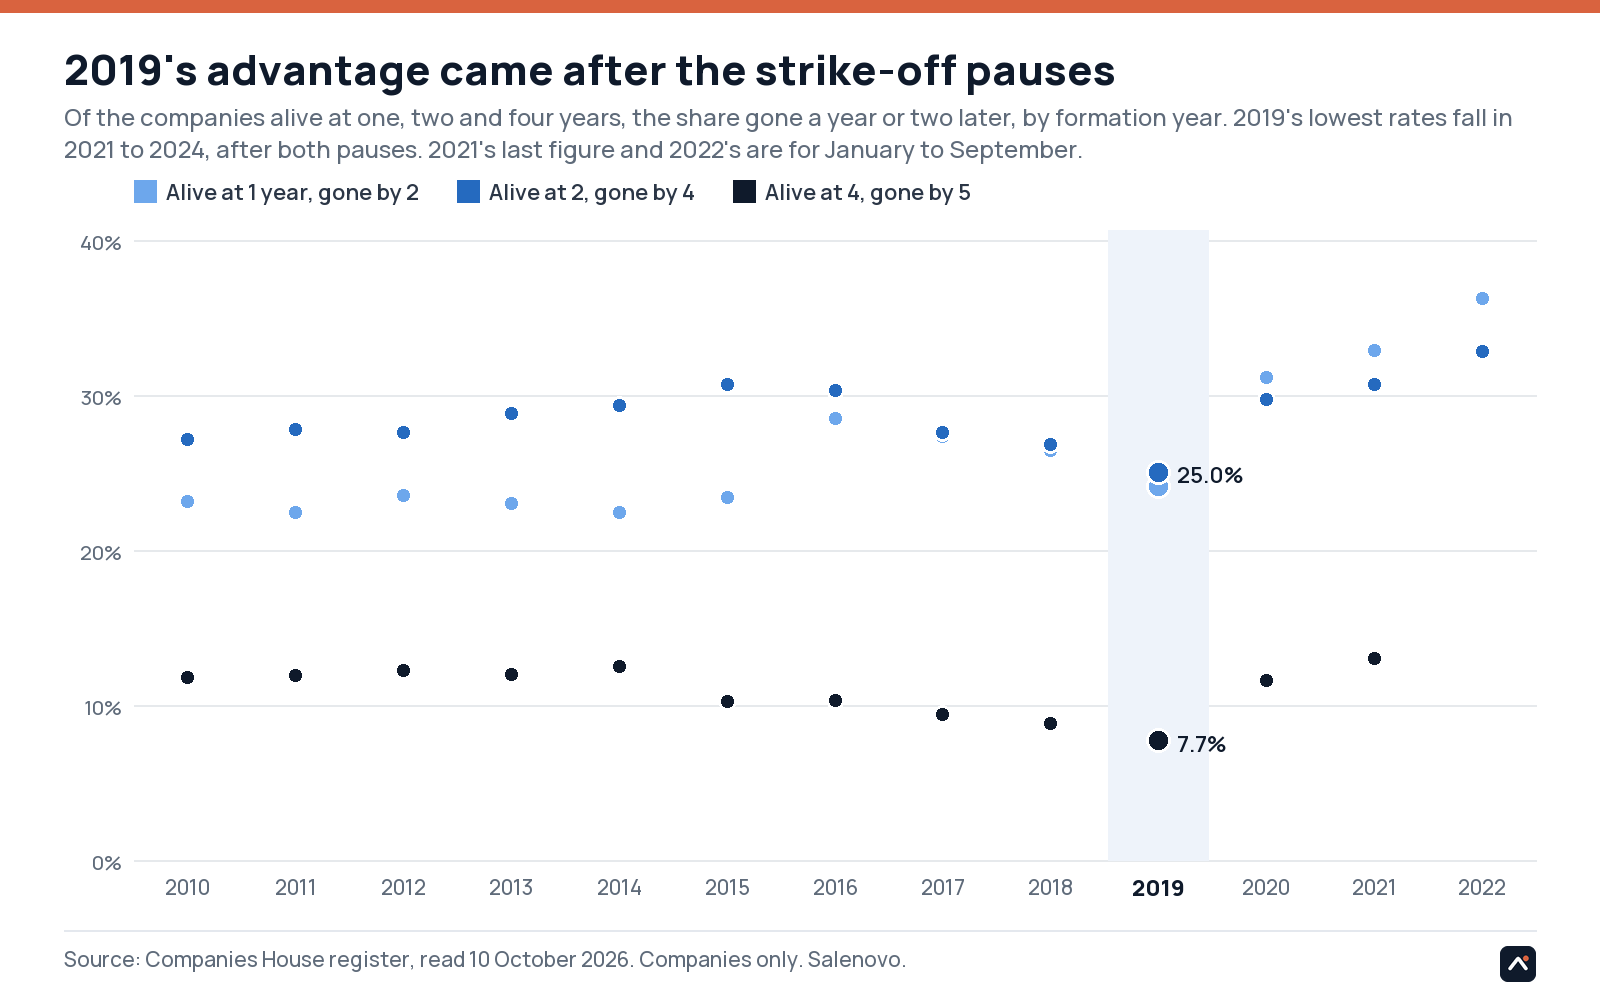
Companies House paused strike-offs from 2 April 2020 (voluntary resumed from 10 September 2020, compulsory from 10 October) and again from 21 January to 8 March 2021. Companies formed from about October 2017 to September 2019 reached the age at which non-filers are normally struck off during a pause, so their two-year figures are flattered. The test is whether those deaths were delayed or avoided. The exit rate of the survivors, by age, shows 2019's advantage is in its third to fifth years, 2021 to 2024, after both pauses: of its companies alive at two years, 25.0% had gone by four, the lowest of any cohort; of those alive at four, 7.7% had gone by five, also the lowest.
The register can't say why. Four candidates, none tested here: 2019 companies were the last cohort trading on 1 March 2020 and so eligible for Bounce Back Loans and furlough; a lender's objection blocks a strike-off and Bounce Back lenders objected routinely, which keeps defunct companies on the register in exactly the years where 2019's advantage appears; the pauses gave slow filers time to catch up; and what people formed from 2020 (online shops, property vehicles) isn't what they formed in 2019.
Exit rate of the survivors, by age
The £50 fee
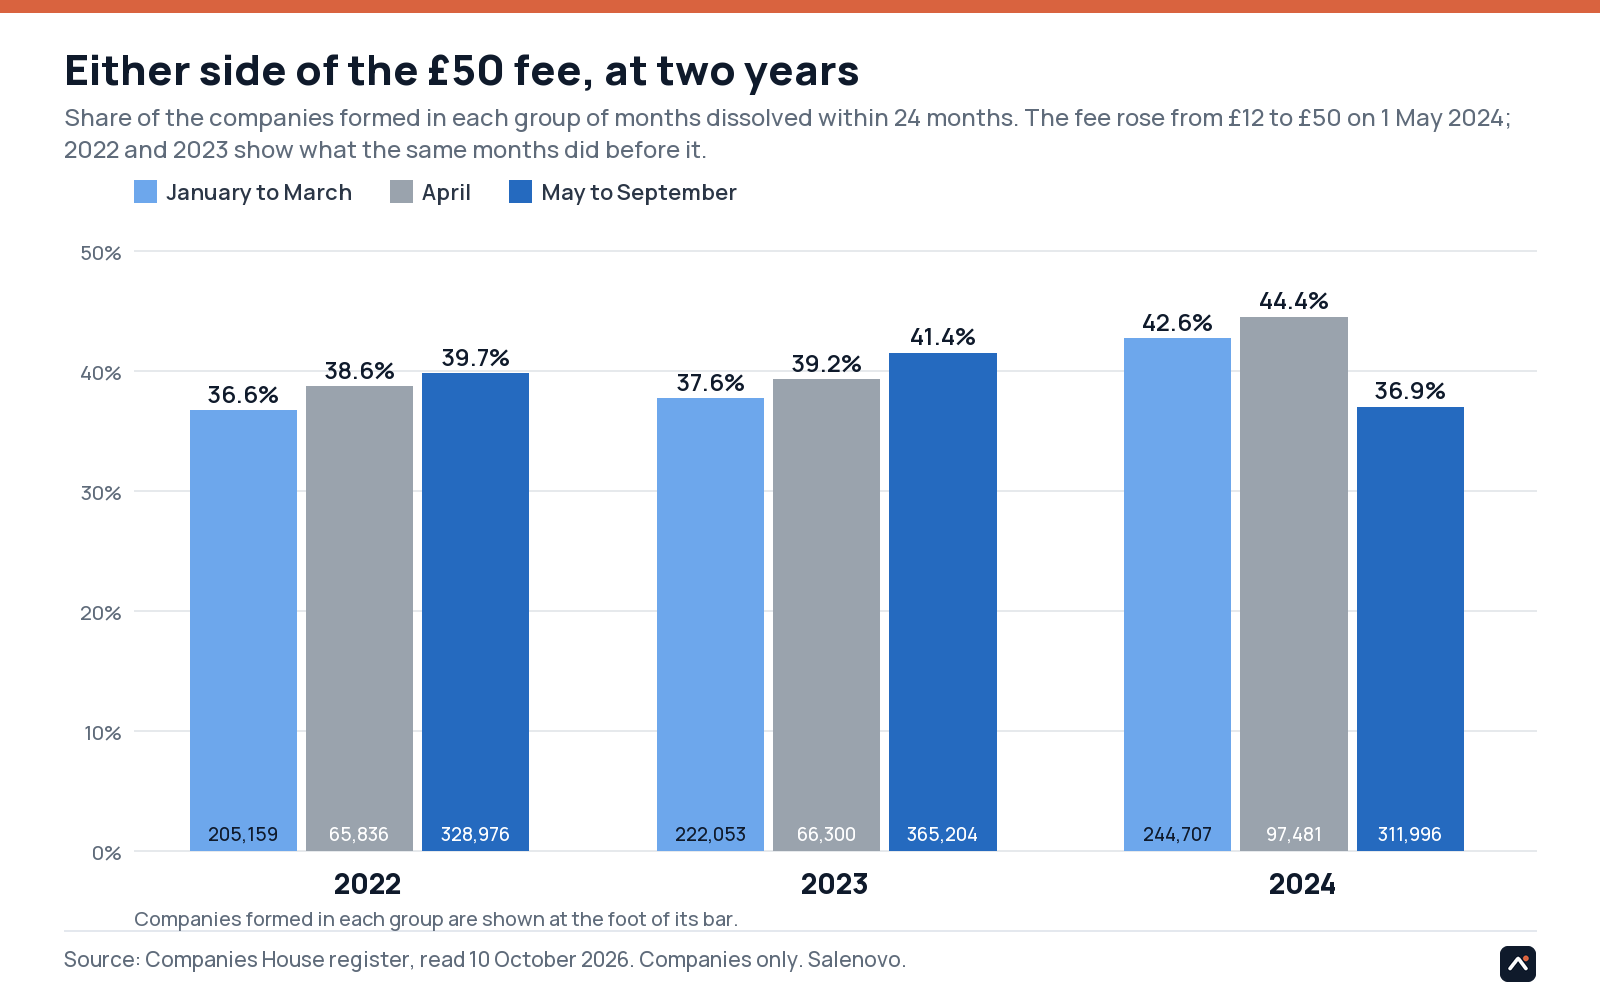
Incorporation fees rose from £12 to £50 on 1 May 2024. Companies formed in the five months after are, so far, outlasting the ones formed just before: 36.9% of the May to September 2024 cohort had gone at two years, against 42.6% for January to March 2024 and 44.4% for the 97,481 formed in April 2024 as people beat the deadline. In 2022 and 2023 the later months did 3 to 4 points worse than the earlier ones, not 6 points better, so after seasonal adjustment the post-fee cohorts are about 9 points better than expected: 9.2 points against the average of the two years before, 8.8 against 2022 alone and 9.5 against 2023. Half of that comes from the post-fee cohort doing better than the year before (4.5 points) and half from the months before the fee doing worse than the year before (5.0 points). That started in late 2023, not with the April rush: 43.5% of the October 2023 to March 2024 cohorts had gone at two years, and December 2023 (46.6%) is the month with the most gone at two years in the whole series.
The register can't say whether the fee did that or just changed who formed a company. The post-fee months formed 15% fewer companies than the same months of 2023, and a smaller, self-selected intake that paid more will last longer whatever the fee does to any one company. The registrar's new strike-off powers arrived two months earlier, on 4 March 2024, and the 2024 cohorts have lived their whole lives under them. The level is still worse than any pre-2020 cohort.
The April 2024 rush also lost more of its companies in the first year than any other month: 9.0%. First-year exits rose from 2.1% of the 2010 cohort to 4.3% of 2023's and 6% of 2024's and 2025's. A company can't be struck off by the registrar for not filing inside its first 12 to 13 months (the first confirmation statement is due at 12 months and 14 days, then come two letters and a two-month notice in the Gazette), so before 2024 the one-year column is almost entirely voluntary strike-offs: owners giving up, or never starting. That share doubled over the decade before the registrar had any new power. The step to 6% from the December 2023 cohort (6.6%, against 4.8% in November) coincides with the registrar's new powers from 4 March 2024 and its address-checking programme (Companies House: 100,400 companies affected between 4 March 2024 and 3 March 2025). But the 2025 cohorts are just as high after that programme ended. So the column is mostly companies choosing to go, plus, from 2024, the registrar's new powers, and these figures can't separate the two.
Gone at two years, same months of each year
The month you start
Pooled over the 2013 to 2019 cohorts, March starters do best (51.5% gone at five years) and August starters worst (54.7%). March is the busiest month for formations and December the quietest; December is second best. Three points between best and worst, and the ordering of the other months changes from year to year. A line, not a finding.
Gone at five years by month of formation, 2013 to 2019
Which trades got worse
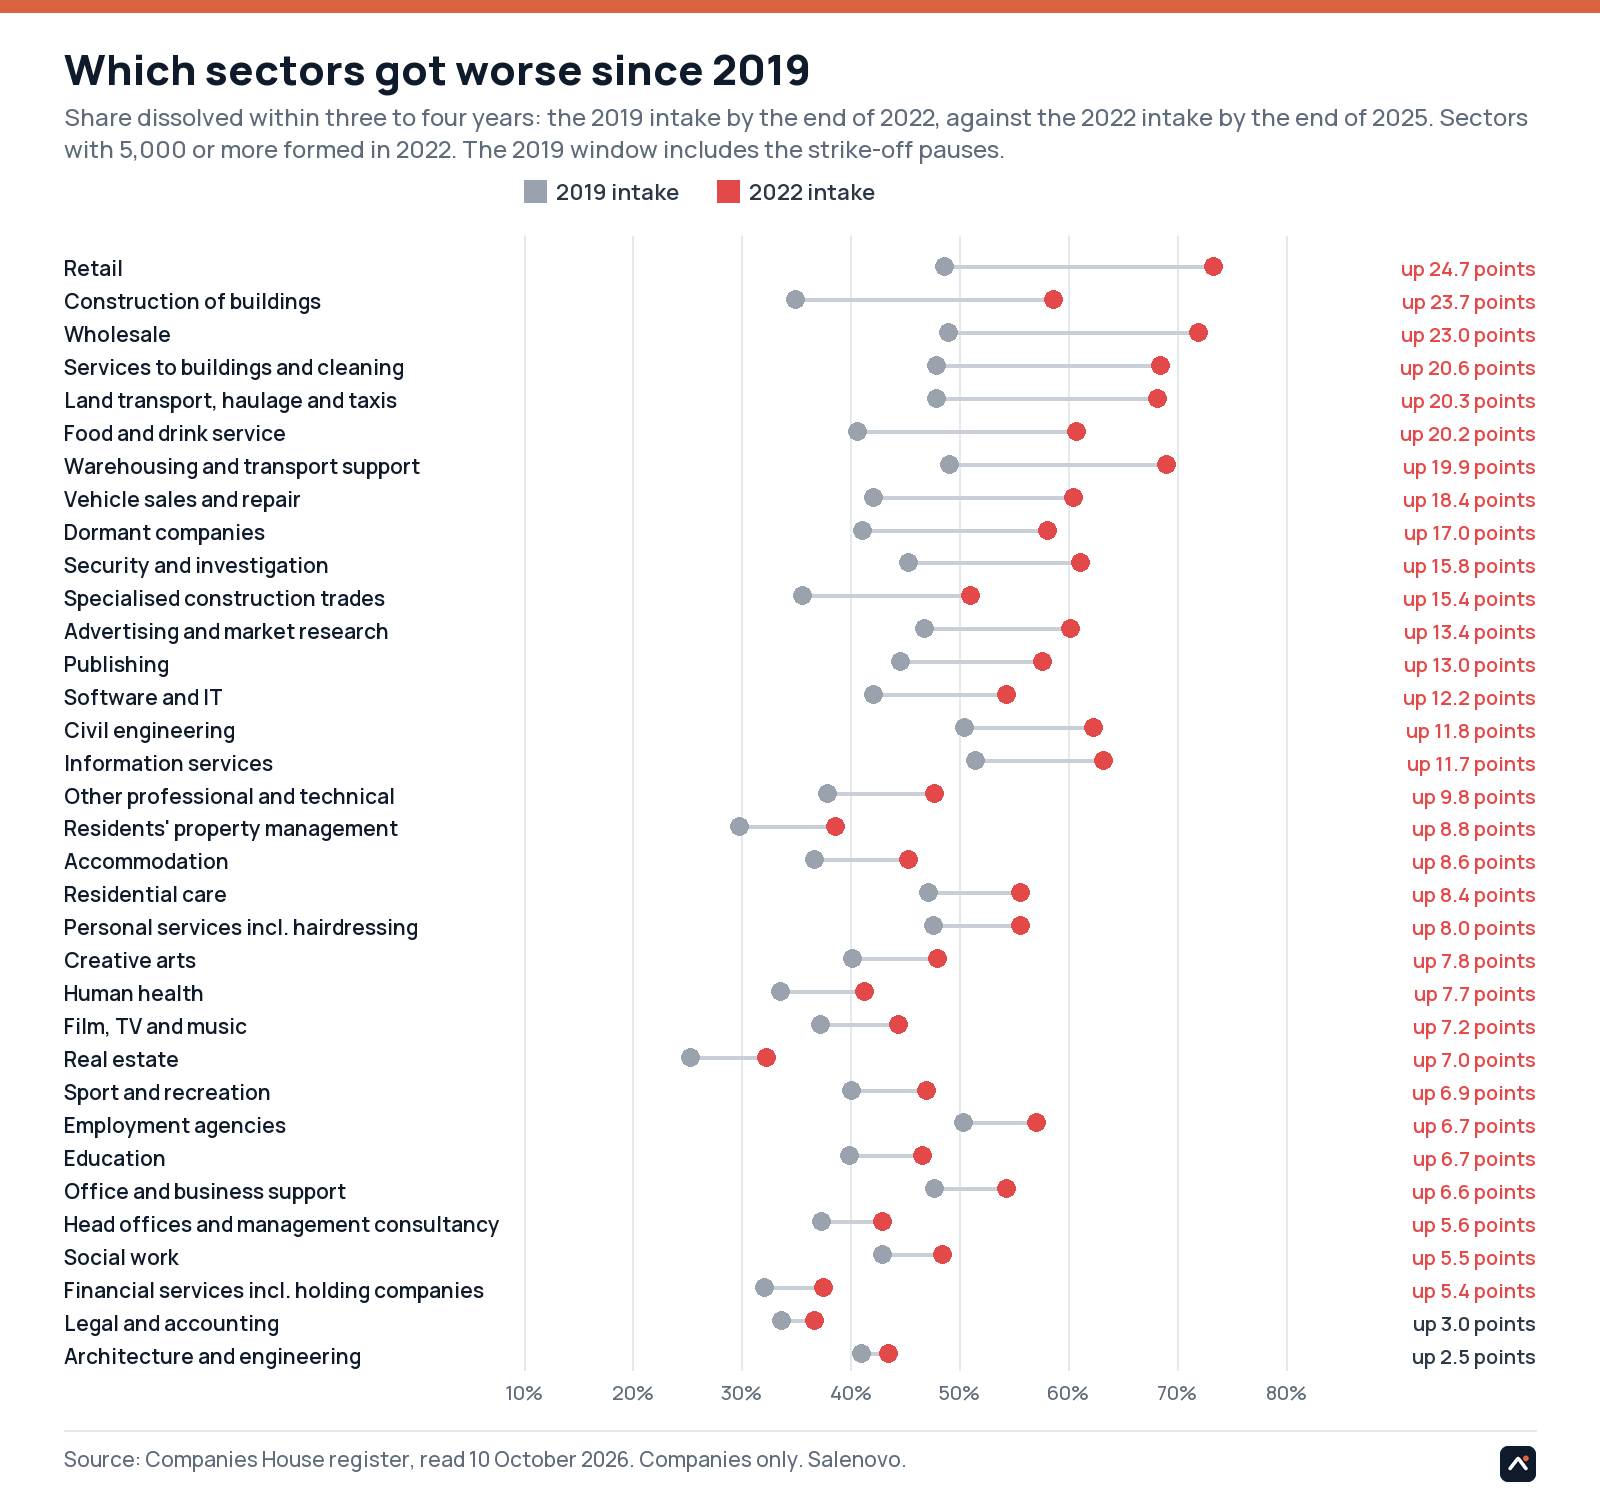
For every trade code, the share of the 2019 intake gone by the end of 2022 against the share of the 2022 intake gone by the end of 2025, the same three-to-four-year window. Across the 243 codes with 500 or more formations in both years the exit rate went from 41% to 54%, and 96% of codes got worse. The fall isn't evenly spread: retail, wholesale, building, cleaning, haulage and food service lost twenty points or more; the licensed professions, property and holding companies lost a few. The register can't say whether those trades got harder or what people registered under them changed; the formations piece shows the second is at least part of it.
Retail went from 49% to 73%, construction of buildings from 35% to 59%, wholesale from 49% to 72% and food and drink service from 41% to 61%. Legal and accounting went from 34% to 37%, real estate from 25% to 32% and holding companies from 19% to 22%.
Exit within three to four years, 2019 intake against 2022 intake
| Sector | Formed 2019 | Formed 2022 | 2019 intake gone by end 2022 | 2022 intake gone by end 2025 | Change |
|---|---|---|---|---|---|
| Retail | 66,272 | 125,638 | 48.6% | 73.3% | up 24.7 points |
| Construction of buildings | 34,897 | 44,952 | 34.9% | 58.6% | up 23.7 points |
| Wholesale | 28,235 | 43,783 | 49.0% | 72.0% | up 23.0 points |
| Services to buildings and cleaning | 13,766 | 24,261 | 47.9% | 68.5% | up 20.6 points |
| Land transport, haulage and taxis | 22,446 | 23,841 | 47.9% | 68.2% | up 20.3 points |
| Food and drink service | 50,338 | 55,716 | 40.6% | 60.8% | up 20.2 points |
| Warehousing and transport support | 9,726 | 8,886 | 49.1% | 69.0% | up 19.9 points |
| Vehicle sales and repair | 17,102 | 21,033 | 42.1% | 60.5% | up 18.4 points |
| Dormant companies | 12,417 | 15,367 | 41.1% | 58.1% | up 17.0 points |
| Security and investigation | 4,291 | 5,308 | 45.3% | 61.1% | up 15.8 points |
| Specialised construction trades | 47,063 | 54,053 | 35.6% | 51.0% | up 15.4 points |
| Advertising and market research | 9,467 | 12,586 | 46.8% | 60.2% | up 13.4 points |
| Publishing | 6,027 | 7,760 | 44.6% | 57.6% | up 13.0 points |
| Software and IT | 47,337 | 52,722 | 42.1% | 54.3% | up 12.2 points |
| Civil engineering | 6,285 | 5,878 | 50.5% | 62.3% | up 11.8 points |
| Information services | 11,249 | 11,614 | 51.5% | 63.2% | up 11.7 points |
| Other professional and technical | 24,130 | 24,276 | 37.9% | 47.7% | up 9.8 points |
| Residents' property management | 8,745 | 9,801 | 29.8% | 38.6% | up 8.8 points |
| Accommodation | 5,362 | 6,098 | 36.7% | 45.3% | up 8.6 points |
| Residential care | 8,641 | 12,698 | 47.2% | 55.6% | up 8.4 points |
| Personal services incl. hairdressing | 45,402 | 41,738 | 47.6% | 55.6% | up 8.0 points |
| Creative arts | 12,658 | 12,759 | 40.2% | 48.0% | up 7.8 points |
| Human health | 24,335 | 33,012 | 33.6% | 41.3% | up 7.7 points |
| Film, TV and music | 11,202 | 12,452 | 37.2% | 44.4% | up 7.2 points |
| Real estate | 81,778 | 111,676 | 25.3% | 32.3% | up 7.0 points |
| Sport and recreation | 11,000 | 11,096 | 40.1% | 47.0% | up 6.9 points |
| Employment agencies | 12,243 | 13,569 | 50.4% | 57.1% | up 6.7 points |
| Education | 19,242 | 22,052 | 39.9% | 46.6% | up 6.7 points |
| Office and business support | 38,106 | 29,694 | 47.7% | 54.3% | up 6.6 points |
| Head offices and management consultancy | 46,081 | 40,118 | 37.3% | 42.9% | up 5.6 points |
| Social work | 5,202 | 6,914 | 42.9% | 48.4% | up 5.5 points |
| Financial services incl. holding companies | 20,876 | 25,639 | 32.1% | 37.5% | up 5.4 points |
| Legal and accounting | 10,884 | 9,119 | 33.7% | 36.7% | up 3.0 points |
| Architecture and engineering | 17,820 | 15,511 | 41.0% | 43.5% | up 2.5 points |
The ones that last can be spotted early
The closures aren't random. Salenovo scores every new company within days of it being registered, from what's public about it: its name and type of business, whether it has a website that matches, and similar signals. Tested on 20,000 companies formed in 2022 and 2023, among the fastest-closing years in this piece, and each scored by a model that had never seen it: three years on, 89% of the companies in band A were still on the register and 76% had become trading businesses, against 27% and 13% in band E and 49% and 33% for all of them.
| Band | Companies | Still on the register at three years | Became trading businesses |
|---|---|---|---|
| Band A | 2,779 | 89% | 76% |
| Band B | 2,987 | 70% | 48% |
| Band C | 2,866 | 55% | 36% |
| Band D | 3,592 | 43% | 27% |
| Band E | 7,776 | 27% | 13% |
Every year at every age
| Formed | Companies | Gone within 12 months | Gone within 24 months | Gone within 36 months | Gone within 48 months | Gone within 60 months | Alive at 5 years |
|---|---|---|---|---|---|---|---|
| 2010 | 389,536 | 2.1% | 24.7% | 36.9% | 45.1% | 51.6% | 48.4% |
| 2011 | 440,522 | 2.2% | 24.2% | 36.6% | 45.3% | 51.8% | 48.2% |
| 2012 | 479,455 | 2.4% | 25.4% | 37.2% | 46.0% | 52.5% | 47.5% |
| 2013 | 517,110 | 2.7% | 25.1% | 37.9% | 46.6% | 53.0% | 47.0% |
| 2014 | 573,581 | 2.6% | 24.4% | 37.6% | 46.6% | 53.3% | 46.7% |
| 2015 | 598,555 | 3.0% | 25.7% | 39.8% | 48.5% | 53.7% | 46.3% |
| 2016 | 646,628 | 3.4% | 30.9% | 45.3% | 51.9% | 56.9% | 43.1% |
| 2017 | 622,646 | 3.2% | 29.7% | 42.4% | 49.1% | 53.8% | 46.2% |
| 2018 | 657,799 | 3.4% | 28.9% | 41.3% | 47.9% | 52.5% | 47.5% |
| 2019 | 678,322 | 2.9% | 26.4% | 38.7% | 44.7% | 49.0% | 51.0% |
| 2020 | 768,663 | 3.6% | 33.6% | 47.0% | 53.3% | 58.8% | 41.2% |
| 2021 | 759,274 | 3.5% | 35.3% | 48.1% | 55.1% | 60.4% (Jan to Sep) | 39.6% |
| 2022 | 784,043 | 3.9% | 38.7% | 51.6% | 58.7% (Jan to Sep) | ||
| 2023 | 867,988 | 4.3% | 41.1% | 53.4% (Jan to Sep) | |||
| 2024 | 835,442 | 6.0% | 40.1% (Jan to Sep) | ||||
| 2025 (Jan to Sep) | 636,885 | 5.9% (Jan to Sep) |
What these figures can and can't say
- Companies only: the Companies Act types. LLPs, limited partnerships, overseas companies and registered overseas entities are excluded because the register never marks them dissolved. Restricted this way the index matches the official count of incorporations to within 0.03% for 2010 to 2013.
- Dissolved isn't failed. Companies in liquidation, or with a Gazette notice but not yet struck off, count as alive. Companies dissolved and later restored count as alive (one to two per cent of dissolutions, under a point for any cohort).
- The strike-off pauses of 2020 and 2021 delay deaths for the cohorts whose second year fell in them. The 48 and 60-month columns and the survivors' exit rates are where to read those years.
- Cohort composition changes. What people formed from 2020 isn't what they formed in 2019, and this index can't separate a worse economy from a different intake.
- The fee comparison is at equal age with the same months of the two previous years as placebos, but the post-fee cohorts have lived their whole lives under the registrar's new strike-off powers (from 4 March 2024), the intake is self-selected, and the design can't separate the fee from either.
- This piece is national. Each council's and constituency's own survival figures are on its page.
- Nothing here says why any of it happened.
Sources
Companies House advanced search (find-and-update.company-information.service.gov.uk), read 10 October 2026. Companies House, "Incorporated companies in the UK, October to December 2021" (strike-off pause dates) and "Companies Register Activities 2013-14", Table A3, gov.uk. Companies House fees, gov.uk (1 May 2024). Companies House news, 30 June 2025 (address checks). The tables behind every chart are in the downloads below. How the counts were made, the checks against the official series and the design of the fee comparison are on the method page.
Downloads
Cite this
Free to quote and reproduce with attribution. Suggested form:
To put the chart on your own page, with the credit built in:
The data are Companies House and ONS material under the Open Government Licence v3.0. A cut for any region or council is available on request: matt@salenovo.com.
Council-by-council survival and trading rates are at /survival/; the method, its accuracy and its agreement with ONS Business Demography at /method/. Every incorporation, weekly, by council: the Formation Index.