New companies in Cities of London and Westminster
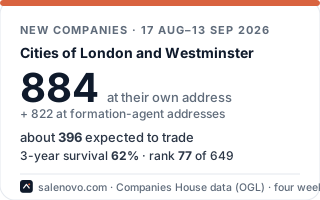
1,033 companies were formed at their own address in Cities of London and Westminster in the four weeks to 25 October, about 462 of which are expected to trade; another 816 were registered at mass-formation or virtual-office addresses. Of the companies formed in the constituency in 2022 and 2023, 62% were still on the register three years later (76th of 649 constituencies).
Updated 30 October 2026 · covers the four weeks to Sunday 25 October 2026 · next update Monday · JSON · all constituencies, CSV
MP: Rachel Blake (Labour (Co-op)) · London · England · Council areas: Westminster (80%), City of London (20%) · all constituencies
Another 816 companies were registered in Cities of London and Westminster over the same four weeks at mass-formation or virtual-office addresses (44% of the 1,849 in total). They're left out of the headline because they say more about the formation agent than about the constituency. The dashed line on the chart shows them. What these addresses are, and what becomes of the companies there.
What they do
Primary SIC code of the companies formed at their own address in Cities of London and Westminster in the last four weeks.
What happens to them
Of the 26,034 companies formed in Cities of London and Westminster between January 2022 and September 2023 at their own address, 62% were still on the register three years later and 44% had filed trading accounts (UK: 51% and 35%; London: 49% and 32%). That puts it 76th of 649 constituencies on three-year survival. A further 18,903 were registered at mass-formation or virtual-office addresses (42% of the total) and are left out, because their outcomes say more about the agent than the place. Most of the rest never traded: they missed their first confirmation statement and were struck off at about seventeen months. The rank is a description, not a verdict. Survival tracks the local sector mix and deprivation more than anything a constituency does, and a few points either way is within the noise for a seat of this size. Every council and constituency compared · how this is measured · CSV.
By sector
| Sector | Companies | Still registered at three years | Filed trading accounts | London: still registered | UK: still registered |
|---|---|---|---|---|---|
| Finance and insurance | 4,400 | 71% | 58% | 64% | 70% |
| Professional, scientific and technical | 3,044 | 63% | 44% | 56% | 60% |
| Information and communication | 2,940 | 60% | 43% | 52% | 54% |
| Property | 2,743 | 78% | 58% | 71% | 72% |
| Retail | 2,275 | 29% | 19% | 32% | 35% |
| Business administration and support services | 1,909 | 67% | 46% | 44% | 45% |
| Arts, entertainment, recreation and other services | 1,694 | 62% | 42% | 52% | 55% |
| Production | 1,183 | 63% | 43% | 42% | 48% |
| Wholesale | 1,140 | 43% | 25% | 34% | 35% |
| Construction | 1,069 | 69% | 47% | 45% | 50% |
| Accommodation and food services | 981 | 61% | 41% | 45% | 46% |
| Health | 504 | 69% | 50% | 58% | 60% |
| Education | 368 | 47% | 32% | 53% | 58% |
| Transport and storage | 330 | 63% | 46% | 41% | 37% |
| Motor trades | 131 | 34% | 19% | 39% | 47% |
Companies formed in Cities of London and Westminster between January 2022 and September 2023 at their own address, grouped by the ONS broad industry group of their first SIC code. Only sectors with at least 100 companies here are shown. With 100 companies, a gap of about ten points to the region can be chance, so small differences say little. Every constituency by sector (CSV).
What the 2024 fee rise did here
On 1 May 2024 the fee to incorporate a company rose from £12 to £50. Comparing May to August 2024 with the same months of 2023, companies formed at their own address in Cities of London and Westminster fell from 1254 a month to 1086 (−14%). Of those formed before the change, 28% had been dissolved within eighteen months; of those formed after it, 21%. The share that went on to trade moved from 45% to 50%. Nationally, companies formed at their own address fell 12% and all formations 15%, with no fall in the number of companies that trade. With 5,017 companies before and 4,342 after, a change of less than about 4% either way could be chance. The figures for every region, council and constituency are in the full analysis as CSV. It also has the method and the caveats.
| May to Aug 2023 | May to Aug 2024 | |
|---|---|---|
| Companies formed at their own address, per month | 1254 | 1086 |
| Dissolved within eighteen months | 28% | 21% |
| Went on to trade | 45% | 50% |
What's being started here
New companies registered in Cities of London and Westminster in twelve high street trades, 2019 and 2025, counting only addresses with fewer than ten companies of the same trade. Registered office, not trading address. Source: Companies House register, read 10 October 2026.
Cities of London and Westminster ranks 1st of 650 constituencies for the number of new high street companies in 2025.
| Trade (SIC code) | 2019 | 2025 | Change |
|---|---|---|---|
| Hairdressing and beauty 96020 | 116 | 111 | down 5 |
| Takeaways and food stands 56103 | 107 | 82 | down 25 |
| Vehicle repair and servicing 45200 | 28 | 21 | down 7 |
| Other education 85590 | 120 | 151 | up 31 |
| Other human health 86900 | 134 | 178 | up 44 |
| Cleaning of buildings 81210 | 11 | 51 | up 40 |
| Convenience stores 47110 | 25 | 26 | up 1 |
| Cafés 56102 | 89 | 106 | up 17 |
| Roofing 43910 | 13 | 19 | up 6 |
| Gyms and sports facilities 93110 | 11 | 30 | up 19 |
| Driving schools 85530 | 5 | 6 | up 1 |
| Pharmacies 47730 | 3 | 7 | up 4 |
| All twelve trades | 662 | 788 | up 126 |
Across the UK, the trade codes chosen by new companies rose 36% between 2019 and 2025, partly because founders now pick more codes for each company, so a rise in one trade can simply keep pace with the register. A company can choose up to four trade codes, so one company can appear in two rows and is counted in the total once for each. What Britain starts now has the national figures, the method and the caveats.
Pubs and bars here
Pub and bar sites in Cities of London and Westminster registered for VAT or PAYE, as counted by the Office for National Statistics each March (UK Business Counts, SIC 56302, rounded to 5). ONS publishes these boundaries for March 2025 and 2026 only. In March 2026, 97% of them were run by a company.
| Pub and bar sites | March 2025 | March 2026 |
|---|---|---|
| Cities of London and Westminster | 590 | 580 |
Nationally there were 37,350 pub and bar sites in March 2026, down 4.6% from March 2019 and down 16.4% from 2010; the fall has run at the same pace since 2019 as in the six years before, and about one registered pub in five closed for good in each of the last two periods, the same share before and after 2019. The pubs piece has the method, the caveats and every council's figures as CSV.
How this is counted
We take every company incorporated in the UK from the Companies House public register the day after it appears, and place it in a constituency by its registered-office postcode using the ONS Postcode Directory (July 2024 boundaries). "Formed at their own address" excludes registrations at addresses that take 100 or more a year (formation agents and virtual offices), because those say where the agent is, not where the business is. "Expected to trade" is the historical trading rate of similar companies from the outcome cohort, summed. It's an estimate for the area, not a judgement on any company. A constituency sees a few dozen formations a week, so the four-week figure is the one to quote and a single week shouldn't be. The official ONS business demography for the area arrives about fifteen months after the fact and stops at local-authority level. This is the same register, counted weekly. Method and accuracy · how survival is measured.
Put Cities of London and Westminster's numbers on your own website
A small card with the constituency's latest figures. It updates itself every Monday. Paste the code into any page: a constituency website, a newsletter template, a council business page. Free, with attribution to Salenovo and Companies House.
Cite this page
Free to quote with attribution to Salenovo and Companies House. A ready-made line:
MPs' offices, councils and journalists wanting a different cut (dissolutions, a sector, a comparison with neighbouring constituencies, a longer series) can email hello@salenovo.com. A constituency cut is usually ready the same day. The figures behind this page: JSON · every constituency, CSV.